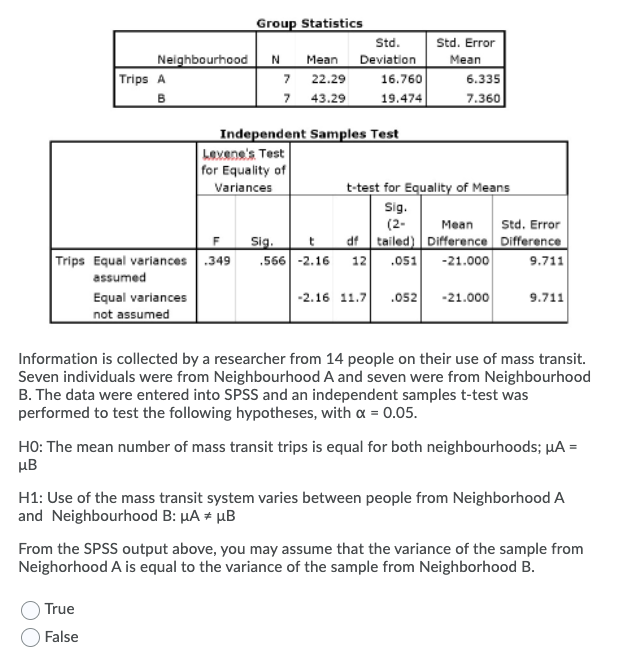
Group Statistics Std. Error Mean Std. Мean Neighbourhood Trips A Deviation N 7 22.29 7 43.29 16.760 19.474 6.335 B 7.360 Independent Samples Test Levene's Test for Equality of Variances t-test for Equality of Means Sig. (2- Мean Std. Error df tailed) Difference Difference Trips Equal variances .349 Sig. .566 -2.16 12 .051 -21.000 9.711 assumed Equal variances -2.16 11.7 .052 -21.000 9.711 not assumed Information is collected by a researcher from 14 people on their use of mass transit. Seven individuals were from Neighbourhood A and seven were from Neighbourhood B. The data were entered into SPSS and an independent samples t-test was performed to test the following hypotheses, with a = 0.05. HO: The mean number of mass transit trips is equal for both neighbourhoods; µA = µB H1: Use of the mass transit system varies between people from Neighborhood A and Neighbourhood B: µA # µB From the SPSS output above, you may assume that the variance of the sample from Neighorhood A is equal to the variance of the sample from Neighborhood B. True False
Group Statistics Std. Error Mean Std. Мean Neighbourhood Trips A Deviation N 7 22.29 7 43.29 16.760 19.474 6.335 B 7.360 Independent Samples Test Levene's Test for Equality of Variances t-test for Equality of Means Sig. (2- Мean Std. Error df tailed) Difference Difference Trips Equal variances .349 Sig. .566 -2.16 12 .051 -21.000 9.711 assumed Equal variances -2.16 11.7 .052 -21.000 9.711 not assumed Information is collected by a researcher from 14 people on their use of mass transit. Seven individuals were from Neighbourhood A and seven were from Neighbourhood B. The data were entered into SPSS and an independent samples t-test was performed to test the following hypotheses, with a = 0.05. HO: The mean number of mass transit trips is equal for both neighbourhoods; µA = µB H1: Use of the mass transit system varies between people from Neighborhood A and Neighbourhood B: µA # µB From the SPSS output above, you may assume that the variance of the sample from Neighorhood A is equal to the variance of the sample from Neighborhood B. True False

Glencoe Algebra 1, Student Edition, 9780079039897, 0079039898, 2018
18th Edition
ISBN:9780079039897
Author:Carter
Publisher:Carter
Chapter10: Statistics
Section10.6: Summarizing Categorical Data
Problem 26PPS

Related questions
Question
Transcribed Image Text:Group Statistics
Std.
Std. Error
Neighbourhood
Trips A
B
Mean
Deviation
Mean
7
22.29
16.760
6.335
7 43.29
19.474
7.360
Independent Samples Test
Levene's Test
for Equality of
Variances
t-test for Equality of Means
Sig.
(2-
Мean
Std. Error
df tailed) Difference Difference
Trips Equal variances .349
Sig.
,566 -2.16
12
.051
-21.000
9.711
assumed
Equal variances
-2.16 11.7
.052
-21.000
9.711
not assumed
Information is collected by a researcher from 14 people on their use of mass transit.
Seven individuals were from Neighbourhood A and seven were from Neighbourhood
B. The data were entered into SPSS and an independent samples t-test was
performed to test the following hypotheses, with a = 0.05.
HO: The mean number of mass transit trips is equal for both neighbourhoods; µA =
µB
H1: Use of the mass transit system varies between people from Neighborhood A
and Neighbourhood B: µA * µB
From the SPSS output above, you may assume that the variance of the sample from
Neighorhood A is equal to the variance of the sample from Neighborhood B.
True
False
Transcribed Image Text:A medical geographer in Kenya is studying the distribution of an infectious strain of
"sleeping sickness". She believes it should be more prevalent among human
populations that live in river floodplains. Data were collected on the number of
infections from a random sample of 100 people on a floodplain and a second sample
of 125 people living in an adjacent highlands area. 10 people from the floodplain and
8 people from the highlands were found to be infected. The proportion of people on
a flood plain that were infected is P1. The proportion of people from the highlands is
that were infected is P2.
What is the research hypothesis?
O P1 > P2
P1 > P2
OP1 = P2
P1 < P2
P1 +P2
P1 < P2
Expert Solution
This question has been solved!
Explore an expertly crafted, step-by-step solution for a thorough understanding of key concepts.

Step by step
Solved in 2 steps

Recommended textbooks for you
Glencoe Algebra 1, Student Edition, 9780079039897…
Algebra
ISBN:
9780079039897
Author:
Carter
Publisher:
McGraw Hill

Big Ideas Math A Bridge To Success Algebra 1: Stu…
Algebra
ISBN:
9781680331141
Author:
HOUGHTON MIFFLIN HARCOURT
Publisher:
Houghton Mifflin Harcourt

Holt Mcdougal Larson Pre-algebra: Student Edition…
Algebra
ISBN:
9780547587776
Author:
HOLT MCDOUGAL
Publisher:
HOLT MCDOUGAL
Glencoe Algebra 1, Student Edition, 9780079039897…
Algebra
ISBN:
9780079039897
Author:
Carter
Publisher:
McGraw Hill
Big Ideas Math A Bridge To Success Algebra 1: Stu…
Algebra
ISBN:
9781680331141
Author:
HOUGHTON MIFFLIN HARCOURT
Publisher:
Houghton Mifflin Harcourt
Holt Mcdougal Larson Pre-algebra: Student Edition…
Algebra
ISBN:
9780547587776
Author:
HOLT MCDOUGAL
Publisher:
HOLT MCDOUGAL

College Algebra (MindTap Course List)
Algebra
ISBN:
9781305652231
Author:
R. David Gustafson, Jeff Hughes
Publisher:
Cengage Learning