Groups: 1 = 5-25 years, 2 = 26-59 years, 3= 60-92 years What can you conclude about mean differences for Groups 2 and 3? Group of answer choices: 1. FIQ for Group 2 differs from the FIQ of Group 3 2. FIQ for Group 2 is higher than the FIQ of Group 3 3. FIQ for Group 2 is lower than the FIQ of Group 3 4. FIQ for Group 2 is not different from the FIQ of Group 3
Groups: 1 = 5-25 years, 2 = 26-59 years, 3= 60-92 years What can you conclude about mean differences for Groups 2 and 3? Group of answer choices: 1. FIQ for Group 2 differs from the FIQ of Group 3 2. FIQ for Group 2 is higher than the FIQ of Group 3 3. FIQ for Group 2 is lower than the FIQ of Group 3 4. FIQ for Group 2 is not different from the FIQ of Group 3

MATLAB: An Introduction with Applications
6th Edition
ISBN:9781119256830
Author:Amos Gilat
Publisher:Amos Gilat
Chapter1: Starting With Matlab
Section: Chapter Questions
Problem 1P

Related questions
Question
Groups: 1 = 5-25 years, 2 = 26-59 years, 3= 60-92 years
What can you conclude about mean differences for Groups 2 and 3?
Group of answer choices:
1. FIQ for Group 2 differs from the FIQ of Group 3
2. FIQ for Group 2 is higher than the FIQ of Group 3
3. FIQ for Group 2 is lower than the FIQ of Group 3
4. FIQ for Group 2 is not different from the FIQ of Group 3
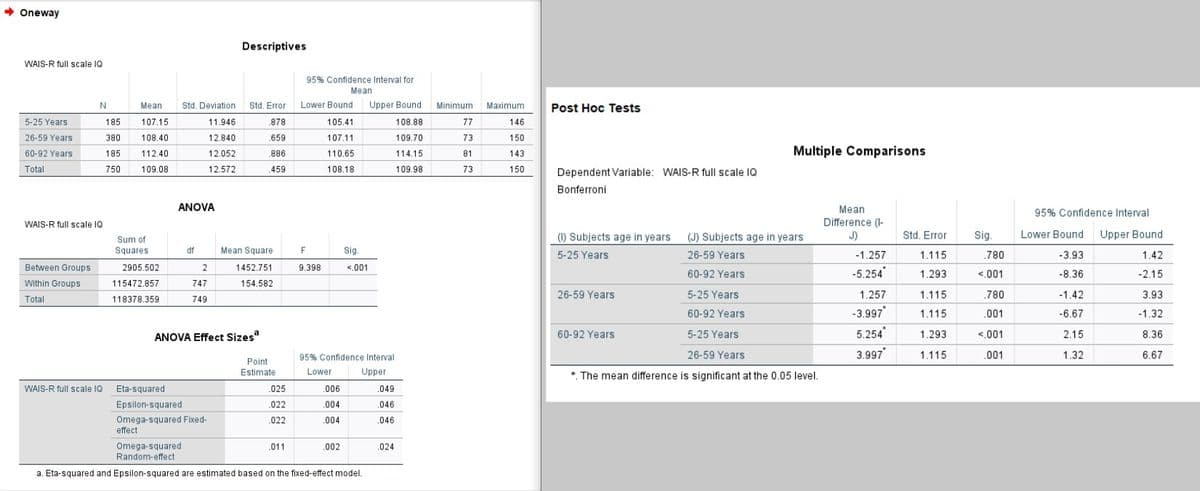
Transcribed Image Text:+ Oneway
Descriptives
WAIS-R full scale IQ
95% Confidence Interval for
Mean
N
Mean
Std. Deviation Std. Error Lower Bound Upper Bound
Minimum
Maximum
Post Hoc Tests
5-25 Years
185
107.15
11.946
878
105.41
108.88
77
146
26-59 Years
380
108.40
12.840
.659
107.11
109.70
73
150
110.65
114.15
Multiple Comparisons
60-92 Years
185
112.40
12.052
.886
81
143
Total
750
109.08
12.572
459
108.18
109.98
73
150
Dependent Variable: WAIS-R full scale IQ
Bonferroni
ANOVA
Mean
Difference (I-
J)
95% Confidence Interval
WAIS-R full scale IQ
() Subjects age in years (J) Subjects age in years
Std. Error
Sig.
Lower Bound Upper Bound
Sum of
Squares
df
Mean Square
F
Si.
5-25 Years
26-59 Years
-1.257
1.115
.780
-3.93
1.42
Between Groups
2905.502
2
1452.751
9.398
<.001
-5.254
1.293
<.001
60-92 Years
-8.36
-2.15
Within Groups
115472.857
747
154.582
26-59 Years
5-25 Years
1.257
1.115
.780
-1.42
3.93
Total
118378.359
749
60-92 Years
-3.997
.001
-6.67
1.115
-1.32
ANOVA Effect Sizes
60-92 Years
5-25 Years
5.254
1.293
<.001
2.15
8.36
26-59 Years
3.997
1.115
.001
1.32
6.67
95% Confidence Interval
Point
Estimate
Lower
Upper
*. The mean difference is significant at the 0.05 level.
WAIS-R full scale 1Q Eta-squared
.025
.006
.049
Epsilon-squared
.022
.004
.046
Omega-squared Fixed-
.022
.004
.046
effect
Omega-squared
Random-effect
.011
.002
.024
a. Eta-squared and Epsilon-squared are estimated based on the fixed-effect model.
Expert Solution
This question has been solved!
Explore an expertly crafted, step-by-step solution for a thorough understanding of key concepts.

Step by step
Solved in 3 steps

Recommended textbooks for you
MATLAB: An Introduction with Applications
Statistics
ISBN:
9781119256830
Author:
Amos Gilat
Publisher:
John Wiley & Sons Inc

Probability and Statistics for Engineering and th…
Statistics
ISBN:
9781305251809
Author:
Jay L. Devore
Publisher:
Cengage Learning

Statistics for The Behavioral Sciences (MindTap C…
Statistics
ISBN:
9781305504912
Author:
Frederick J Gravetter, Larry B. Wallnau
Publisher:
Cengage Learning
MATLAB: An Introduction with Applications
Statistics
ISBN:
9781119256830
Author:
Amos Gilat
Publisher:
John Wiley & Sons Inc
Probability and Statistics for Engineering and th…
Statistics
ISBN:
9781305251809
Author:
Jay L. Devore
Publisher:
Cengage Learning
Statistics for The Behavioral Sciences (MindTap C…
Statistics
ISBN:
9781305504912
Author:
Frederick J Gravetter, Larry B. Wallnau
Publisher:
Cengage Learning

Elementary Statistics: Picturing the World (7th E…
Statistics
ISBN:
9780134683416
Author:
Ron Larson, Betsy Farber
Publisher:
PEARSON

The Basic Practice of Statistics
Statistics
ISBN:
9781319042578
Author:
David S. Moore, William I. Notz, Michael A. Fligner
Publisher:
W. H. Freeman

Introduction to the Practice of Statistics
Statistics
ISBN:
9781319013387
Author:
David S. Moore, George P. McCabe, Bruce A. Craig
Publisher:
W. H. Freeman