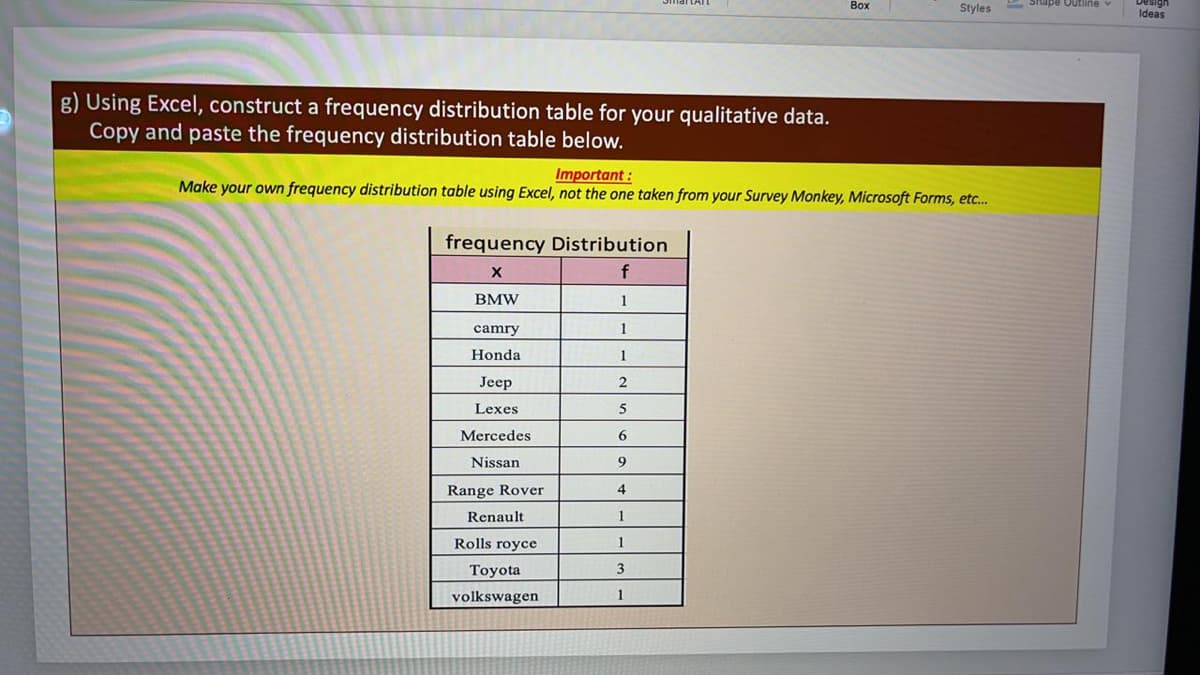
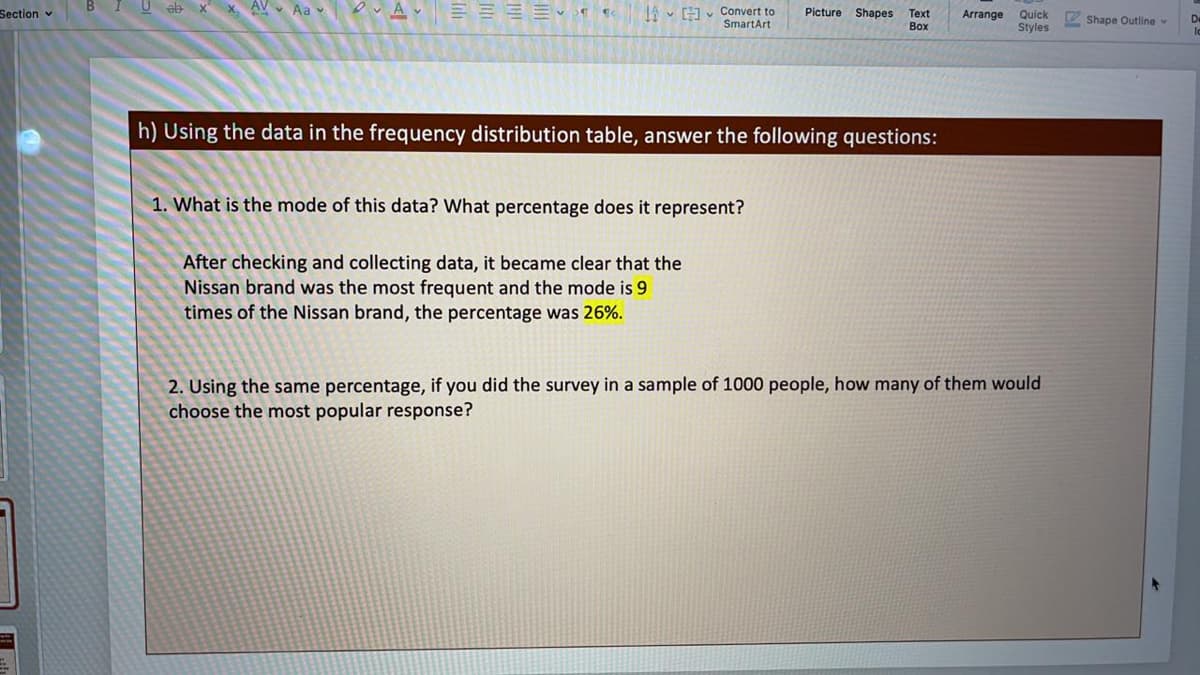
h) Using the data in the frequency distribution table, answer the following questions: 1. What is the mode of this data? What percentage does it represent? After checking and collecting data, it became clear that the Nissan brand was the most frequent and the mode is 9 times of the Nissan brand, the percentage was 26%. 2. Using the same percentage, if you did the survey in a sample of 1000 people, how many of them would choose the most popular response?


Quadratic Equation
When it comes to the concept of polynomial equations, quadratic equations can be said to be a special case. What does solving a quadratic equation mean? We will understand the quadratics and their types once we are familiar with the polynomial equations and their types.
Demand and Supply Function
The concept of demand and supply is important for various factors. One of them is studying and evaluating the condition of an economy within a given period of time. The analysis or evaluation of the demand side factors are important for the suppliers to understand the consumer behavior. The evaluation of supply side factors is important for the consumers in order to understand that what kind of combination of goods or what kind of goods and services he or she should consume in order to maximize his utility and minimize the cost. Therefore, in microeconomics both of these concepts are extremely important in order to have an idea that what exactly is going on in the economy.

Step by step
Solved in 2 steps


