h. For parts e-g, what exact number of adults would produce the highest probability? How does this compare to the expected number?
h. For parts e-g, what exact number of adults would produce the highest probability? How does this compare to the expected number?

Chapter8: Sequences, Series,and Probability
Section8.7: Probability
Problem 50E: Flexible Work Hours In a recent survey, people were asked whether they would prefer to work flexible...

Related questions
Question
question h and expected number
Transcribed Image Text:uppose a
Obabinty
eight
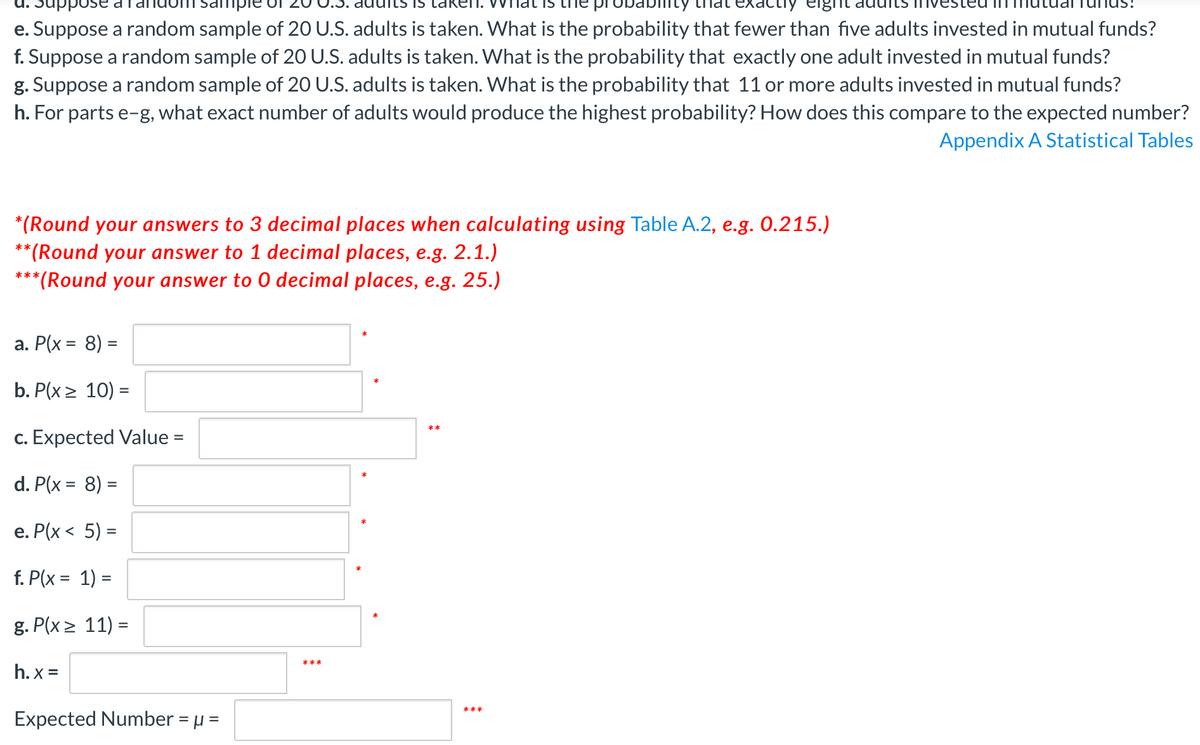
e. Suppose a random sample of 20 U.S. adults is taken. What is the probability that fewer than five adults invested in mutual funds?
f. Suppose a random sample of 20 U.S. adults is taken. What is the probability that exactly one adult invested in mutual funds?
g. Suppose a random sample of 20 U.S. adults is taken. What is the probability that 11 or more adults invested in mutual funds?
h. For parts e-g, what exact number of adults would produce the highest probability? How does this compare to the expected number?
Appendix A Statistical Tables
*(Round your answers to 3 decimal places when calculating using Table A.2, e.g. 0.215.)
*(Round your answer to 1 decimal places, e.g. 2.1.)
**(Round your answer to 0 decimal places, e.g. 25.)
*
a. P(x = 8) =
b. P(x> 10) =
c. Expected Value =
d. P(x = 8) =
%3D
е. Р(х < 5) -
f. P(x = 1) =
%3D
g. P(x > 11) =
***
h. x =
Expected Number = µ =
***
%3D
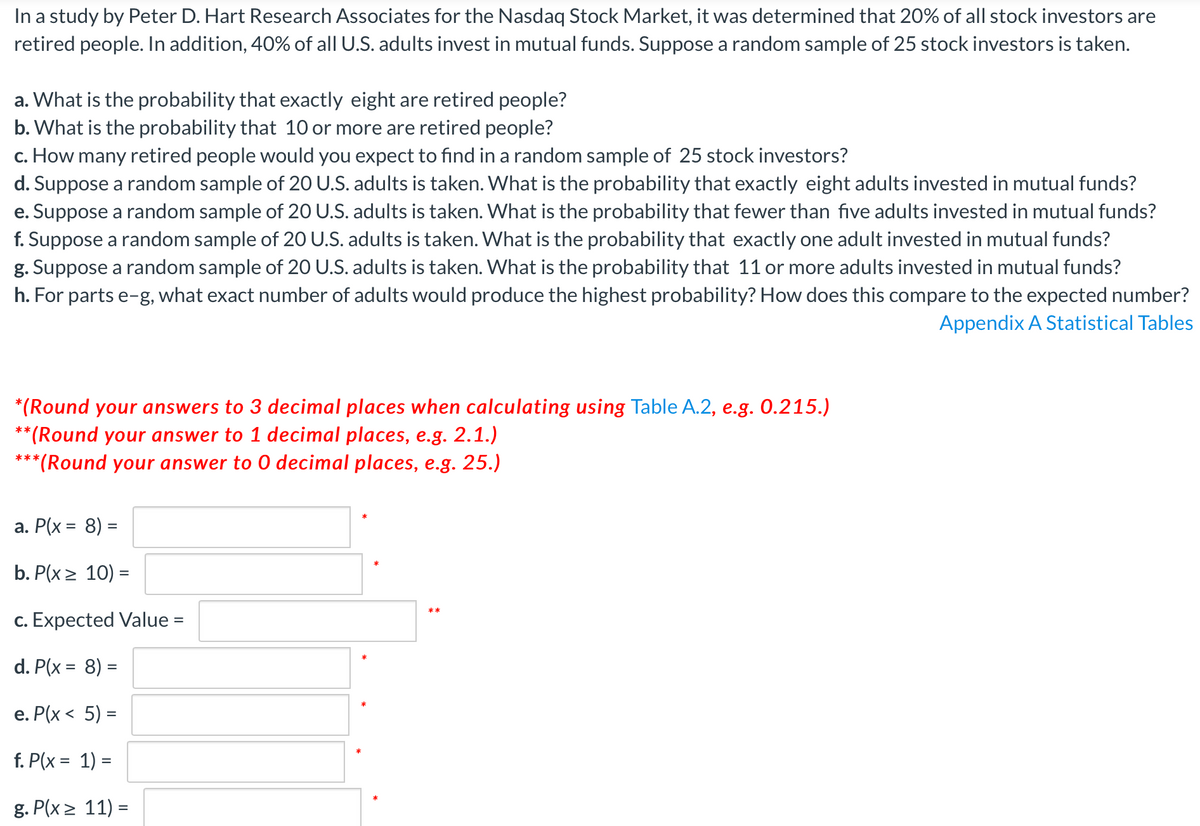
Transcribed Image Text:In a study by Peter D. Hart Research Associates for the Nasdaq Stock Market, it was determined that 20% of all stock investors are
retired people. In addition, 40% of all U.S. adults invest in mutual funds. Suppose a random sample of 25 stock investors is taken.
a. What is the probability that exactly eight are retired people?
b. What is the probability that 10 or more are retired people?
c. How many retired people would you expect to find in a random sample of 25 stock investors?
d. Suppose a random sample of 20 U.S. adults is taken. What is the probability that exactly eight adults invested in mutual funds?
e. Suppose a random sample of 20 U.S. adults is taken. What is the probability that fewer than five adults invested in mutual funds?
f. Suppose a random sample of 20 U.S. adults is taken. What is the probability that exactly one adult invested in mutual funds?
g. Suppose a random sample of 20 U.S. adults is taken. What is the probability that 11 or more adults invested in mutual funds?
h. For parts e-g, what exact number of adults would produce the highest probability? How does this compare to the expected number?
Appendix A Statistical Tables
*(Round your answers to 3 decimal places when calculating using Table A.2, e.g. 0.215.)
*(Round your answer to 1 decimal places, e.g. 2.1.)
**(Round your answer to 0 decimal places, e.g. 25.)
*
а. Р(x %3D 8) %3
b. P(x > 10) =
c. Expected Value =
d. P(x = 8) =
е. Р(х < 5) -
f. P(x = 1) =
%3D
g. P(x > 11) =
Expert Solution
This question has been solved!
Explore an expertly crafted, step-by-step solution for a thorough understanding of key concepts.

This is a popular solution!

Trending now
This is a popular solution!

Step by step
Solved in 2 steps with 3 images

Recommended textbooks for you

Algebra and Trigonometry (MindTap Course List)
Algebra
ISBN:
9781305071742
Author:
James Stewart, Lothar Redlin, Saleem Watson
Publisher:
Cengage Learning
Algebra and Trigonometry (MindTap Course List)
Algebra
ISBN:
9781305071742
Author:
James Stewart, Lothar Redlin, Saleem Watson
Publisher:
Cengage Learning