H_{0}: p₁ ✓ H_{1}:` |p₁ ✓ OF 11 itical value(s): q OF P₂ P₂ critical value and sketch the rejection region. Eetch of Rejection Region: -1 0 1 2 3 -3 -2 -1 0 1 2 3 9 OT -3 -2
H_{0}: p₁ ✓ H_{1}:` |p₁ ✓ OF 11 itical value(s): q OF P₂ P₂ critical value and sketch the rejection region. Eetch of Rejection Region: -1 0 1 2 3 -3 -2 -1 0 1 2 3 9 OT -3 -2

Glencoe Algebra 1, Student Edition, 9780079039897, 0079039898, 2018
18th Edition
ISBN:9780079039897
Author:Carter
Publisher:Carter
Chapter10: Statistics
Section10.6: Summarizing Categorical Data
Problem 27PPS

Related questions
Question
I need the right answers to b, c, d.
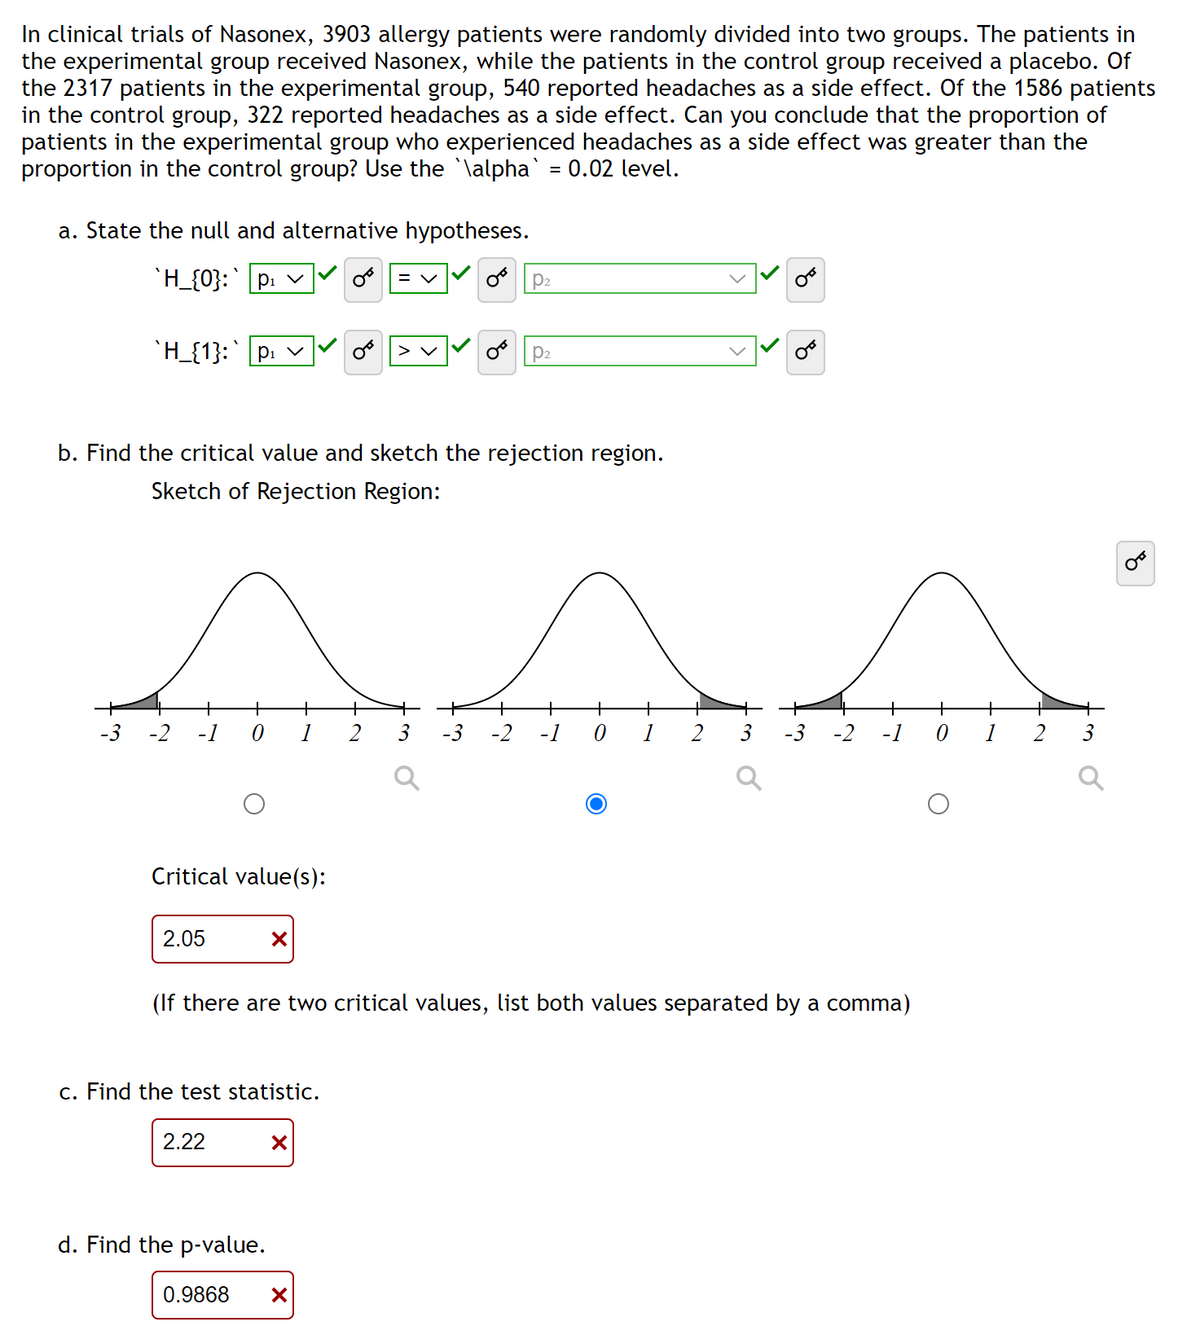
Transcribed Image Text:In clinical trials of Nasonex, 3903 allergy patients were randomly divided into two groups. The patients in
the experimental group received Nasonex, while the patients in the control group received a placebo. Of
the 2317 patients in the experimental group, 540 reported headaches as a side effect. Of the 1586 patients
in the control group, 322 reported headaches as a side effect. Can you conclude that the proportion of
patients in the experimental group who experienced headaches as a side effect was greater than the
proportion in the control group? Use the `\alpha` = 0.02 level.
a. State the null and alternative hypotheses.
`H_{0}: p₁
`H_{1}:` piv
b. Find the critical value and sketch the rejection region.
Sketch of Rejection Region:
+ +
-3 -2 -1 0 1
Critical value(s):
2.05
X
2.22
+
c. Find the test statistic.
d. Find the p-value.
X
0.9868 X
+
2
P₂
3
O P₂
+ + +
-1 0
(If there are two critical values, list both values separated by a comma)
४
2 3 -3
?
+
+
-1 0
+
1
2
♂
४
Expert Solution
This question has been solved!
Explore an expertly crafted, step-by-step solution for a thorough understanding of key concepts.

Step by step
Solved in 7 steps with 25 images

Recommended textbooks for you
Glencoe Algebra 1, Student Edition, 9780079039897…
Algebra
ISBN:
9780079039897
Author:
Carter
Publisher:
McGraw Hill

Holt Mcdougal Larson Pre-algebra: Student Edition…
Algebra
ISBN:
9780547587776
Author:
HOLT MCDOUGAL
Publisher:
HOLT MCDOUGAL

College Algebra (MindTap Course List)
Algebra
ISBN:
9781305652231
Author:
R. David Gustafson, Jeff Hughes
Publisher:
Cengage Learning
Glencoe Algebra 1, Student Edition, 9780079039897…
Algebra
ISBN:
9780079039897
Author:
Carter
Publisher:
McGraw Hill
Holt Mcdougal Larson Pre-algebra: Student Edition…
Algebra
ISBN:
9780547587776
Author:
HOLT MCDOUGAL
Publisher:
HOLT MCDOUGAL
College Algebra (MindTap Course List)
Algebra
ISBN:
9781305652231
Author:
R. David Gustafson, Jeff Hughes
Publisher:
Cengage Learning
