Has the number of shoppers who wear masks changed from 2020 to 2021? There are arguments for and against this question. The mean number of masks, Hx used by a shopper in Metropolis in 2020 will be compared to the mean number of masks, Hy used by a shopper in Metropolis in 2021. The true values of y and Hy are unknown. It is recognized that the true standard deviations are a, = 19 for the 2020 measurements and e, = 24 for the 2021 measurements. We take a random sample of m = 255 shoppers in 2020 and a random sample of n = 200 shoppers in 2021. The mean number of masks were x= 97 for 2020 and y= 85 for 2021. Assuming independence between the years and assuming masks used by shoppers are normally distributed we would like to estimate - Hy- a) What is the standard deviation of the distribution of x? b) What is the standard deviation of the distribution of x - y ? c) Create a 95% confidence interval for y - Hy
Has the number of shoppers who wear masks changed from 2020 to 2021? There are arguments for and against this question. The mean number of masks, Hx used by a shopper in Metropolis in 2020 will be compared to the mean number of masks, Hy used by a shopper in Metropolis in 2021. The true values of y and Hy are unknown. It is recognized that the true standard deviations are a, = 19 for the 2020 measurements and e, = 24 for the 2021 measurements. We take a random sample of m = 255 shoppers in 2020 and a random sample of n = 200 shoppers in 2021. The mean number of masks were x= 97 for 2020 and y= 85 for 2021. Assuming independence between the years and assuming masks used by shoppers are normally distributed we would like to estimate - Hy- a) What is the standard deviation of the distribution of x? b) What is the standard deviation of the distribution of x - y ? c) Create a 95% confidence interval for y - Hy

MATLAB: An Introduction with Applications
6th Edition
ISBN:9781119256830
Author:Amos Gilat
Publisher:Amos Gilat
Chapter1: Starting With Matlab
Section: Chapter Questions
Problem 1P

Related questions
Question
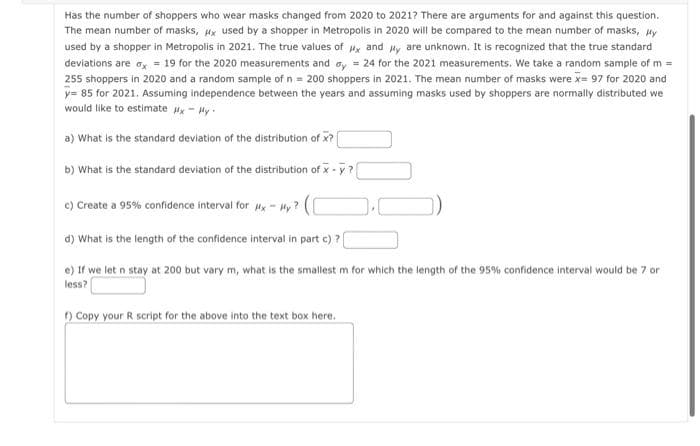
Transcribed Image Text:Has the number of shoppers who wear masks changed from 2020 to 2021? There are arguments for and against this question.
The mean number of masks, ux used by a shopper in Metropolis in 2020 will be compared to the mean number of masks, Hy
used by a shopper in Metropolis in 2021. The true values of Hy and Hy are unknown. It is recognized that the true standard
deviations are ay = 19 for the 2020 measurements and oy = 24 for the 2021 measurements. We take a random sample of m =
255 shoppers in 2020 and a random sample of n = 200 shoppers in 2021. The mean number of masks were x= 97 for 2020 and
y= 85 for 2021. Assuming independence between the years and assuming masks used by shoppers are normally distributed we
would like to estimate Hx - Hy
a) What is the standard deviation of the distribution of x?
b) What is the standard deviation of the distribution of x- y ?
c) Create a 95% confidence interval for My- Hy ? (C
d) What is the length of the confidence interval in part c) ?
e) If we let n stay at 200 but vary m, what is the smallest m for which the length of the 95% confidence interval would be 7 or
less?
) Copy your R script for the above into the text box here.
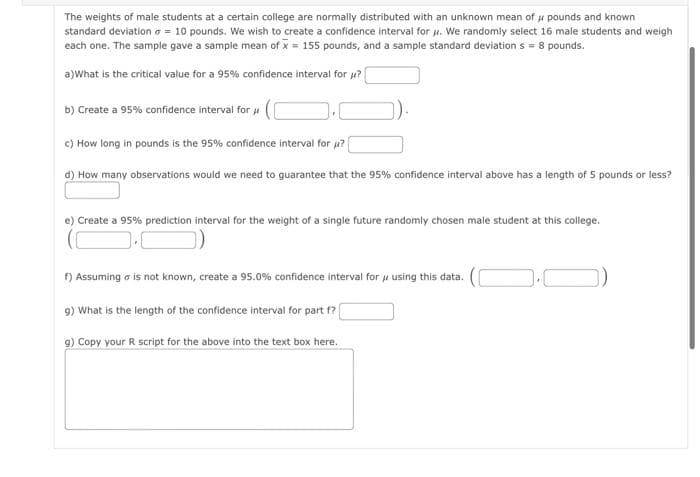
Transcribed Image Text:The weights of male students at a certain college are normally distributed with an unknown mean of u pounds and known
standard deviation a = 10 pounds. We wish to create a confidence interval for u. We randomly select 16 male students and weigh
each one. The sample gave a sample mean of x = 155 pounds, and a sample standard deviation s = 8 pounds.
a)What is the critical value for a 95% confidence interval for u?
b) Create a 95% confidence interval for u
c) How long in pounds is the 95% confidence interval for u?
d) How many observations would we need to guarantee that the 95% confidence interval above has a length of 5 pounds or less?
e) Create a 95% prediction intervai for the weight of a single future randomly chosen male student at this college.
f) Assuming a is not known, create a 95.0% confidence interval for u using this data.
9) What is the length of the confidence interval for part f?
9) Copy your R script for the above into the text box here.
Expert Solution
This question has been solved!
Explore an expertly crafted, step-by-step solution for a thorough understanding of key concepts.

Step by step
Solved in 4 steps with 3 images

Recommended textbooks for you
MATLAB: An Introduction with Applications
Statistics
ISBN:
9781119256830
Author:
Amos Gilat
Publisher:
John Wiley & Sons Inc

Probability and Statistics for Engineering and th…
Statistics
ISBN:
9781305251809
Author:
Jay L. Devore
Publisher:
Cengage Learning

Statistics for The Behavioral Sciences (MindTap C…
Statistics
ISBN:
9781305504912
Author:
Frederick J Gravetter, Larry B. Wallnau
Publisher:
Cengage Learning
MATLAB: An Introduction with Applications
Statistics
ISBN:
9781119256830
Author:
Amos Gilat
Publisher:
John Wiley & Sons Inc
Probability and Statistics for Engineering and th…
Statistics
ISBN:
9781305251809
Author:
Jay L. Devore
Publisher:
Cengage Learning
Statistics for The Behavioral Sciences (MindTap C…
Statistics
ISBN:
9781305504912
Author:
Frederick J Gravetter, Larry B. Wallnau
Publisher:
Cengage Learning

Elementary Statistics: Picturing the World (7th E…
Statistics
ISBN:
9780134683416
Author:
Ron Larson, Betsy Farber
Publisher:
PEARSON

The Basic Practice of Statistics
Statistics
ISBN:
9781319042578
Author:
David S. Moore, William I. Notz, Michael A. Fligner
Publisher:
W. H. Freeman

Introduction to the Practice of Statistics
Statistics
ISBN:
9781319013387
Author:
David S. Moore, George P. McCabe, Bruce A. Craig
Publisher:
W. H. Freeman