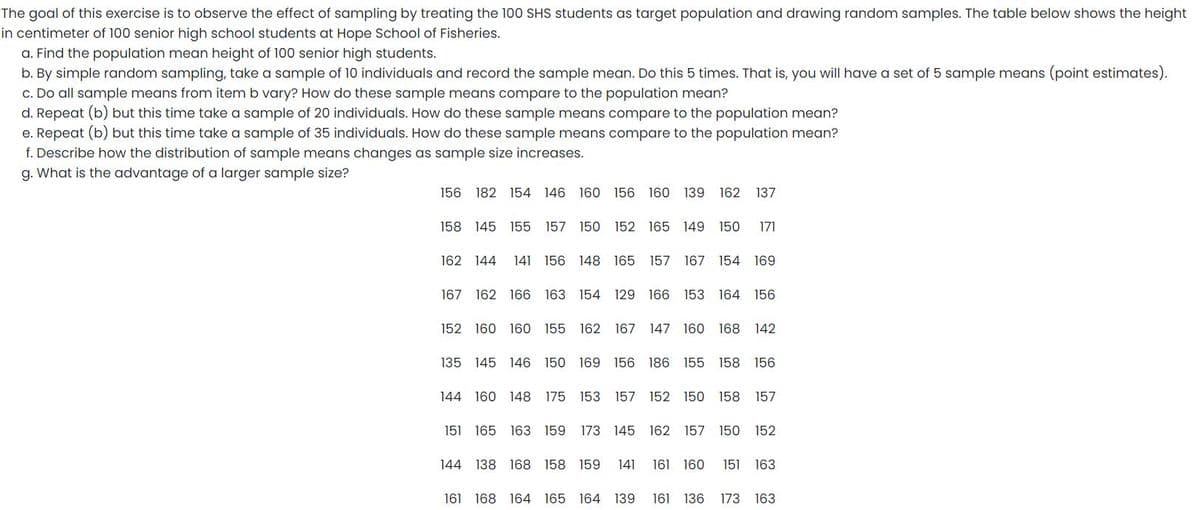
he goal of this exercise is to observe the effect of sampling by treating the 100 SHS students as target population and drawing random samples. The table below shows the height n centimeter of 100 senior high school students at Hope School of Fisheries. a. Find the population mean height of 100 senior high students. b. By simple random sampling, take a sample of 10 individuals and record the sample mean. Do this 5 times. That is, you will have a set of 5 sample means (point estimates). c. Do all sample means from item b vary? How do these sample means compare to the population mean? d. Repeat (b) but this time take a sample of 20 individuals. How do these sample means compare to the population mean? e. Repeat (b) but this time take a sample of 35 individuals. How do these sample means compare to the population mean? f. Describe how the distribution of sample means changes as sample size increases. g. What is the advantage of a larger sample size? 156 182 154 146 160 156 160 139 162 137 158 145 155 157 150 152 165 149 150 171 162 144 141 156 148 165 157 167 154 169 167 162 166 163 154 129 166 153 164 156 152 160 160 155 162 167 147 160 168 142 135 145 146 150 169 156 186 155 158 156 144 160 148 175 153 157 152 150 158 157 151 165 163 159 173 145 162 157 150 152 144 138 168 158 159 141 161 160 151 163 161 168 161 126 164 165 164 120 172 163


Unitary Method
The word “unitary” comes from the word “unit”, which means a single and complete entity. In this method, we find the value of a unit product from the given number of products, and then we solve for the other number of products.
Speed, Time, and Distance
Imagine you and 3 of your friends are planning to go to the playground at 6 in the evening. Your house is one mile away from the playground and one of your friends named Jim must start at 5 pm to reach the playground by walk. The other two friends are 3 miles away.
Profit and Loss
The amount earned or lost on the sale of one or more items is referred to as the profit or loss on that item.
Units and Measurements
Measurements and comparisons are the foundation of science and engineering. We, therefore, need rules that tell us how things are measured and compared. For these measurements and comparisons, we perform certain experiments, and we will need the experiments to set up the devices.
please answer all questions. it would really

Step by step
Solved in 4 steps


