he table below shows the frequency distribution of the rainfall on 52 consecutive Tuesdays in a certain city. Use the frequency distribution to construct a histogram. Do the data appear to have a istribution that is approximately normal? Class 0-0.19 0.20 0.39 0.40-0.59 0.60-0.79 0.80-0.99 1.00-1.19 1.20-1.39 Frequency 22 13 4 1 5 6 1 Choose the correct histogram below. SOA. B. O C. Do the 30- 20- 10- 0+ 0.0 0.2 0.4 0.6 0.8 1.0 1.2 1.4 30- 20- 10- 0- 0.0 0.2 0.4 0.6 0.8 1.0 1.2 1.4 30- 20- 10- 0+ 0.0 0.2 0.4 0.6 0.8 1.0 1.2 1.4 Q Q 5 Q Q G Q G
he table below shows the frequency distribution of the rainfall on 52 consecutive Tuesdays in a certain city. Use the frequency distribution to construct a histogram. Do the data appear to have a istribution that is approximately normal? Class 0-0.19 0.20 0.39 0.40-0.59 0.60-0.79 0.80-0.99 1.00-1.19 1.20-1.39 Frequency 22 13 4 1 5 6 1 Choose the correct histogram below. SOA. B. O C. Do the 30- 20- 10- 0+ 0.0 0.2 0.4 0.6 0.8 1.0 1.2 1.4 30- 20- 10- 0- 0.0 0.2 0.4 0.6 0.8 1.0 1.2 1.4 30- 20- 10- 0+ 0.0 0.2 0.4 0.6 0.8 1.0 1.2 1.4 Q Q 5 Q Q G Q G

Glencoe Algebra 1, Student Edition, 9780079039897, 0079039898, 2018
18th Edition
ISBN:9780079039897
Author:Carter
Publisher:Carter
Chapter10: Statistics
Section10.4: Distributions Of Data
Problem 19PFA

Related questions
Question
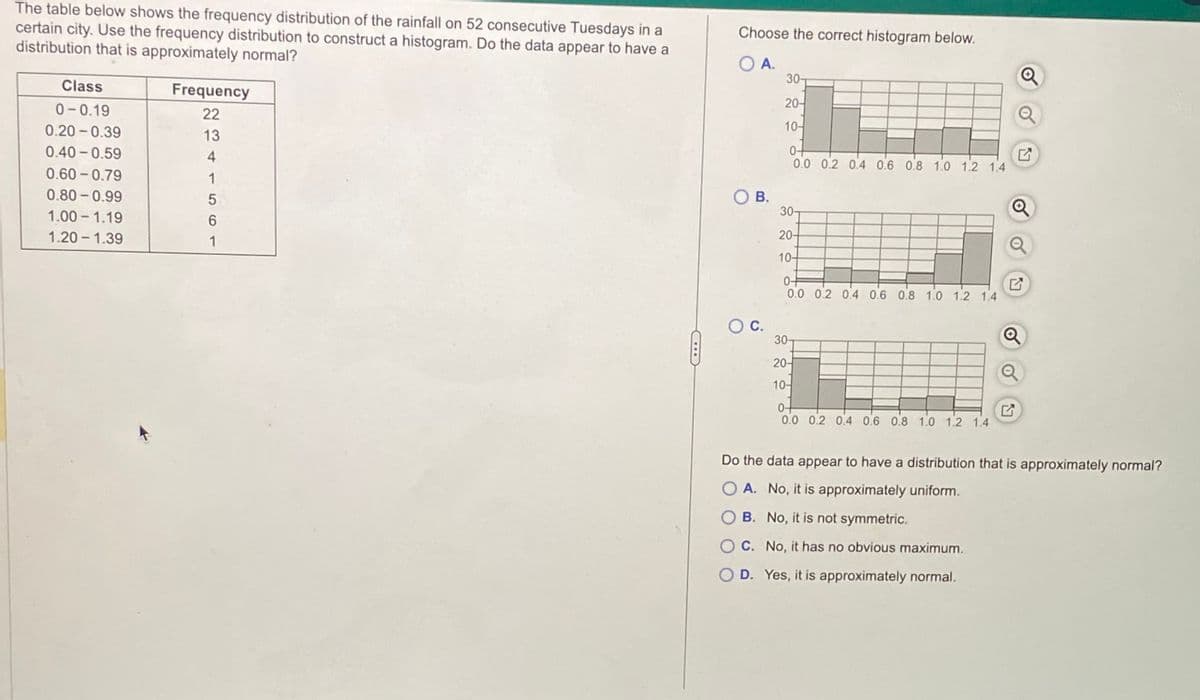
Transcribed Image Text:The table below shows the frequency distribution of the rainfall on 52 consecutive Tuesdays in a
certain city. Use the frequency distribution to construct a histogram. Do the data appear to have a
distribution that is approximately normal?
Class
0-0.19
0.20 -0.39
0.40 -0.59
0.60-0.79
0.80 -0.99
1.00-1.19
1.20-1.39
Frequency
22
13
4
1
5
6
1
Choose the correct histogram below.
OA.
OB.
O C.
30-
20-
10-
0.0 0.2 0.4 0.6 0.8 1.0 1.2 1.4
30-
20-
10-
0+
0.0 0.2 0.4 0.6 0.8 1.0 1.2 1.4
30-
20-
10-
0+
0.0 0.2 0.4 0.6 0.8 1.0 1.2 1.4
Q
Q
Q
Do the data appear to have a distribution that is approximately normal?
O A. No, it is approximately uniform.
OB. No, it is not symmetric.
OC. No, it has no obvious maximum.
O D. Yes, it is approximately normal.
Expert Solution
This question has been solved!
Explore an expertly crafted, step-by-step solution for a thorough understanding of key concepts.

This is a popular solution!

Trending now
This is a popular solution!

Step by step
Solved in 3 steps

Recommended textbooks for you
Glencoe Algebra 1, Student Edition, 9780079039897…
Algebra
ISBN:
9780079039897
Author:
Carter
Publisher:
McGraw Hill
Glencoe Algebra 1, Student Edition, 9780079039897…
Algebra
ISBN:
9780079039897
Author:
Carter
Publisher:
McGraw Hill