3) Elsie, a librarian wants to investigate the length of time, 7 minutes, that people spent in her library on a particular day. Elsie's data for 160 people who visited the library on that particular day is shown in the following table. T (minutes) Frequency 0≤T<20 50 20≤T<40 0 10 62 20 Elsie assumes her data to be representative of future visitors to the library. The following box and whisker diagram shows the times, in minutes, that the 10 visitors spent in the library. 30 40 ≤ T < 60 k 40 60 50 T (minutes) 60 ≤ T < 80 14 70 80 a) State whether the variable T is discrete or continuous. b) Find the value of k. c) 90 80 ≤ T < 100 8 100 Elsie believes the box and whisker diagram indicates that the times spent in the library are not normally distributed. i) Write down the modal class. ii) Write down the mid-interval value for this class. d) Use Elsie's data to calculate an estimate of the mean time that people spent in the library. e) Using the table, write down the maximum possible number of people who spent 35 minutes or less in the library on that day. f) Find the probability a visitor spends at least 60 minutes in the library. g) Write down the median time spent in the library. h) Find the interquartile range. Hence show that the longest time that a person spent in the library is not an outlier
3) Elsie, a librarian wants to investigate the length of time, 7 minutes, that people spent in her library on a particular day. Elsie's data for 160 people who visited the library on that particular day is shown in the following table. T (minutes) Frequency 0≤T<20 50 20≤T<40 0 10 62 20 Elsie assumes her data to be representative of future visitors to the library. The following box and whisker diagram shows the times, in minutes, that the 10 visitors spent in the library. 30 40 ≤ T < 60 k 40 60 50 T (minutes) 60 ≤ T < 80 14 70 80 a) State whether the variable T is discrete or continuous. b) Find the value of k. c) 90 80 ≤ T < 100 8 100 Elsie believes the box and whisker diagram indicates that the times spent in the library are not normally distributed. i) Write down the modal class. ii) Write down the mid-interval value for this class. d) Use Elsie's data to calculate an estimate of the mean time that people spent in the library. e) Using the table, write down the maximum possible number of people who spent 35 minutes or less in the library on that day. f) Find the probability a visitor spends at least 60 minutes in the library. g) Write down the median time spent in the library. h) Find the interquartile range. Hence show that the longest time that a person spent in the library is not an outlier

Glencoe Algebra 1, Student Edition, 9780079039897, 0079039898, 2018
18th Edition
ISBN:9780079039897
Author:Carter
Publisher:Carter
Chapter10: Statistics
Section10.6: Summarizing Categorical Data
Problem 13CYU

Related questions
Question
Can someone please help with g-i? Thank you.
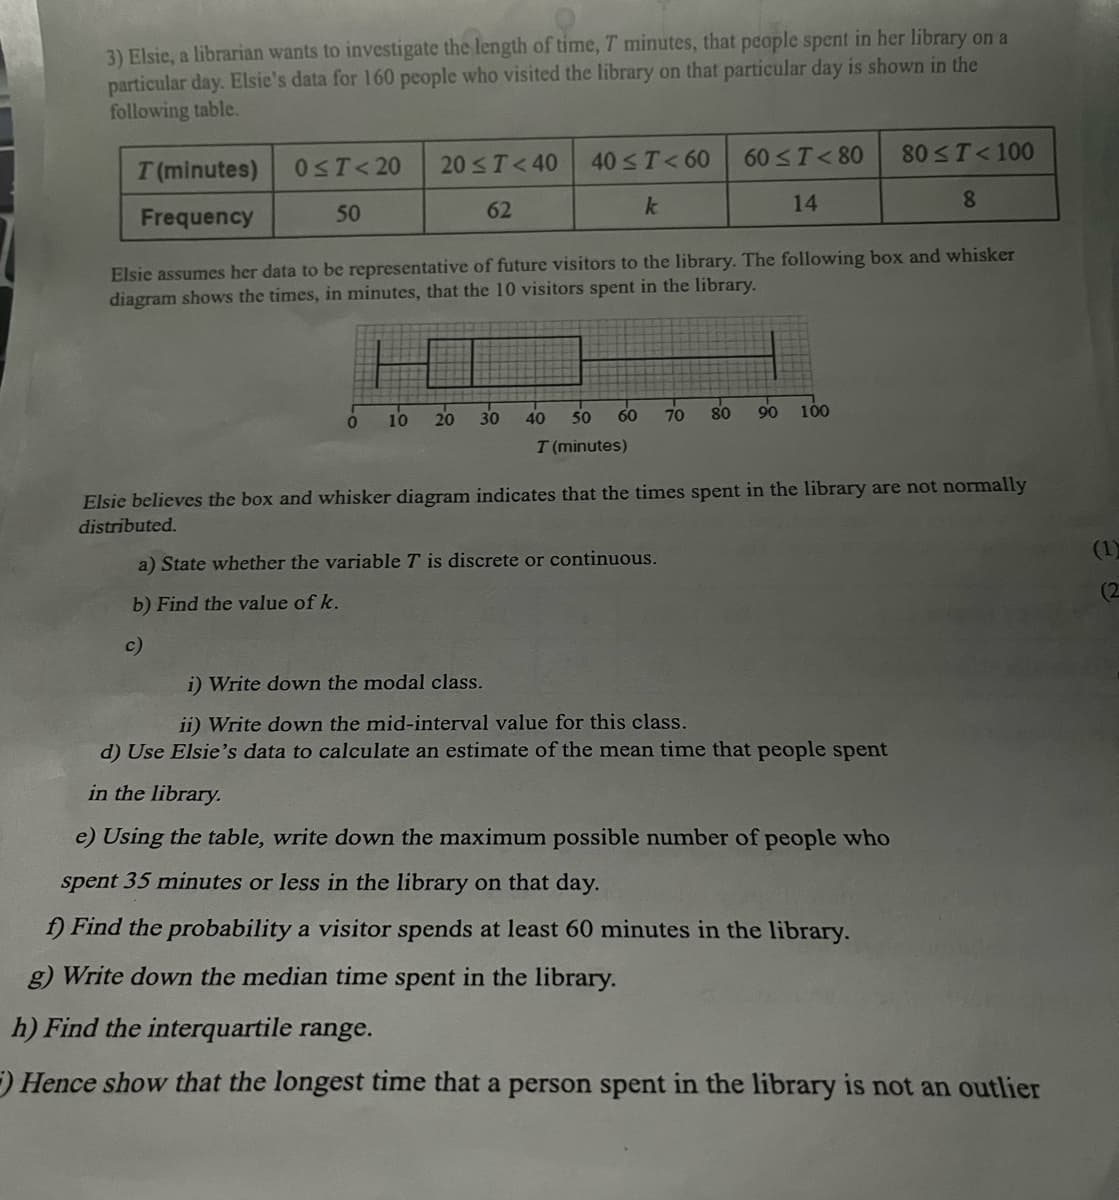
Transcribed Image Text:3) Elsie, a librarian wants to investigate the length of time, 7 minutes, that people spent in her library on a
particular day. Elsie's data for 160 people who visited the library on that particular day is shown in the
following table.
T (minutes)
Frequency
0≤T<20 20 ≤ T <40
50
0
10
62
20
Elsie assumes her data to be representative of future visitors to the library. The following box and whisker
diagram shows the times, in minutes, that the 10 visitors spent in the library.
40 ≤ T <60
k
30
60
40 50
T (minutes)
60 ≤T<80
14
70
a) State whether the variable T is discrete or continuous.
b) Find the value of k.
C)
80 90 100
80≤ T < 100
8
Elsie believes the box and whisker diagram indicates that the times spent in the library are not normally
distributed.
i) Write down the modal class.
ii) Write down the mid-interval value for this class.
d) Use Elsie's data to calculate an estimate of the mean time that people spent
in the library.
e) Using the table, write down the maximum possible number of people who
spent 35 minutes or less in the library on that day.
f) Find the probability a visitor spends at least 60 minutes in the library.
g) Write down the median time spent in the library.
h) Find the interquartile range.
Hence show that the longest time that a person spent in the library is not an outlier
(1)
(2
Expert Solution
This question has been solved!
Explore an expertly crafted, step-by-step solution for a thorough understanding of key concepts.

This is a popular solution!

Trending now
This is a popular solution!

Step by step
Solved in 3 steps with 1 images

Recommended textbooks for you
Glencoe Algebra 1, Student Edition, 9780079039897…
Algebra
ISBN:
9780079039897
Author:
Carter
Publisher:
McGraw Hill

Elements Of Modern Algebra
Algebra
ISBN:
9781285463230
Author:
Gilbert, Linda, Jimmie
Publisher:
Cengage Learning,
Glencoe Algebra 1, Student Edition, 9780079039897…
Algebra
ISBN:
9780079039897
Author:
Carter
Publisher:
McGraw Hill
Elements Of Modern Algebra
Algebra
ISBN:
9781285463230
Author:
Gilbert, Linda, Jimmie
Publisher:
Cengage Learning,