he table shows the age of a painting (x) in years, and its estimated dollar value (y). x2 y 1,200 1,500 2,400 3,200 4,100 2,500 2,916 3,844 4,225 4,624 ху 60,000 81,000 148,800 208,000 278,800 Exy=776,600 50 54 62 65 68 Ex=299 Ey=12,400 Ex²=18,109 Which regression equation correctly models the data? O y = 41.47x + 0.09 O y = 41.47x + 1,279.93 O y = 153.32x-6,688.54 O y = 153.32x - 6,325.76 %3D
he table shows the age of a painting (x) in years, and its estimated dollar value (y). x2 y 1,200 1,500 2,400 3,200 4,100 2,500 2,916 3,844 4,225 4,624 ху 60,000 81,000 148,800 208,000 278,800 Exy=776,600 50 54 62 65 68 Ex=299 Ey=12,400 Ex²=18,109 Which regression equation correctly models the data? O y = 41.47x + 0.09 O y = 41.47x + 1,279.93 O y = 153.32x-6,688.54 O y = 153.32x - 6,325.76 %3D

Algebra & Trigonometry with Analytic Geometry
13th Edition
ISBN:9781133382119
Author:Swokowski
Publisher:Swokowski
Chapter5: Inverse, Exponential, And Logarithmic Functions
Section5.6: Exponential And Logarithmic Equations
Problem 67E

Related questions
Topic Video
Question
need help finding the answer
Transcribed Image Text:A Classes
Zoom - Chrome We.
Edgenuity for Stude..
Jeeks -- Virtual Learning (WHS)
est
Active
21
22
23
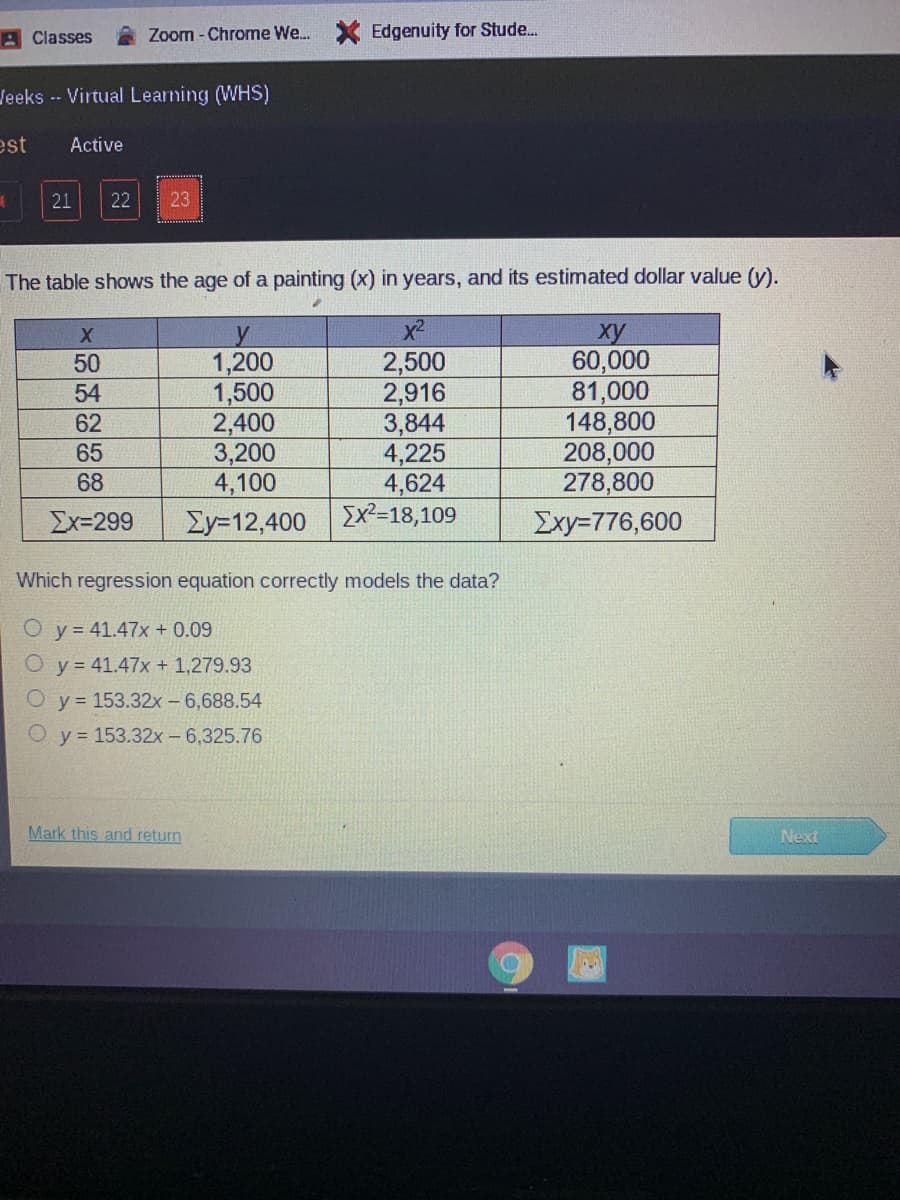
The table shows the age of a painting (x) in years, and its estimated dollar value (y).
x2
1,200
1,500
2,400
3,200
4,100
2,500
2,916
3,844
4,225
4,624
Ex²=18,109
ху
60,000
81,000
148,800
208,000
278,800
50
54
62
65
68
Ex=299
Ey=12,400
Exy=776,600
Which regression equation correctly models the data?
O y = 41.47x + 0.09
O y= 41.47x + 1,279.93
y = 153.32x - 6,688.54
y = 153.32x - 6,325.76
Mark this and return
Next
Expert Solution
This question has been solved!
Explore an expertly crafted, step-by-step solution for a thorough understanding of key concepts.

This is a popular solution!

Trending now
This is a popular solution!

Step by step
Solved in 2 steps with 1 images

Knowledge Booster


Learn more about
Need a deep-dive on the concept behind this application? Look no further. Learn more about this topic, geometry and related others by exploring similar questions and additional content below.Recommended textbooks for you
Algebra & Trigonometry with Analytic Geometry
Algebra
ISBN:
9781133382119
Author:
Swokowski
Publisher:
Cengage

Linear Algebra: A Modern Introduction
Algebra
ISBN:
9781285463247
Author:
David Poole
Publisher:
Cengage Learning
Algebra & Trigonometry with Analytic Geometry
Algebra
ISBN:
9781133382119
Author:
Swokowski
Publisher:
Cengage
Linear Algebra: A Modern Introduction
Algebra
ISBN:
9781285463247
Author:
David Poole
Publisher:
Cengage Learning