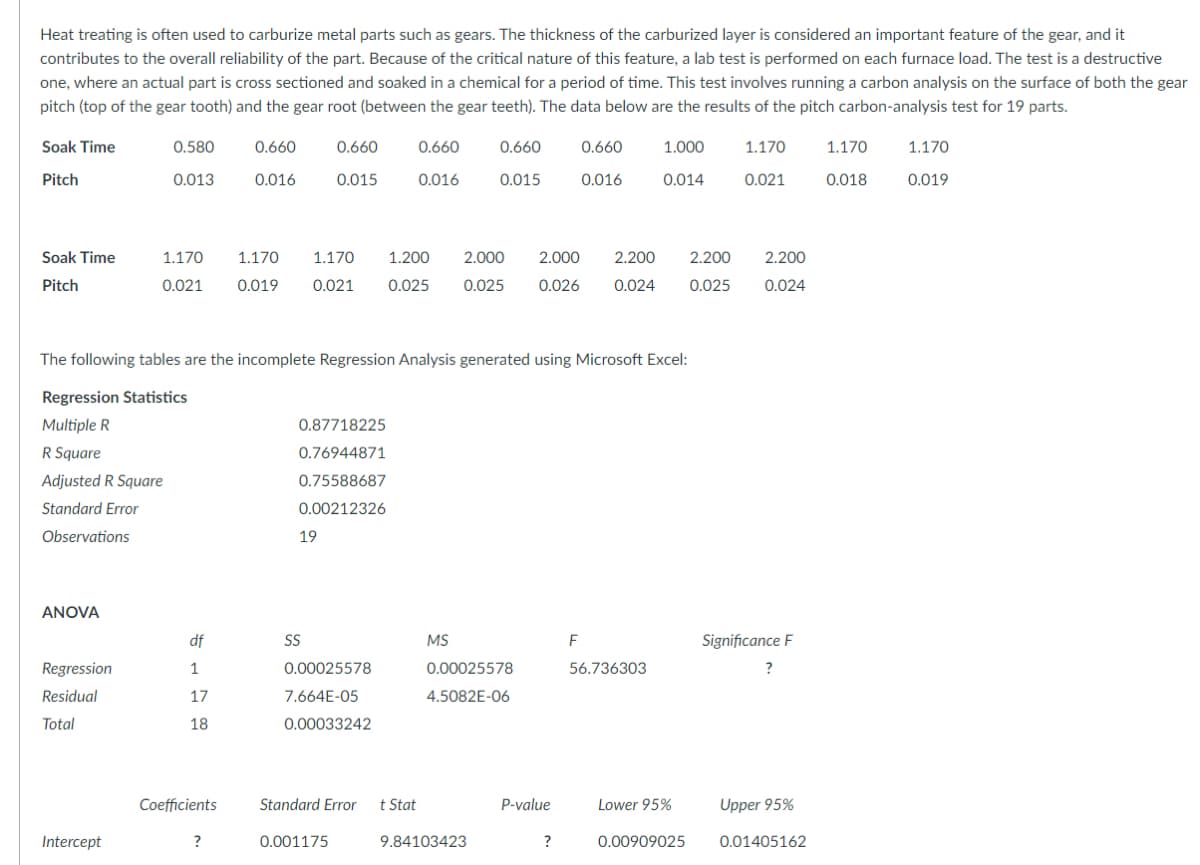
Heat treating is often used to carburize metal parts such as gears. The thickness of the carburized layer is considered an important feature of the gear, and it contributes to the overall reliability of the part. Because of the critical nature of this feature, a lab test is performed on each furnace load. The test is a destructive one, where an actual part is cross sectioned and soaked in a chemical for a period of time. This test involves running a carbon analysis on the surface of both the gear pitch (top of the gear tooth) and the gear root (between the gear teeth). The data below are the results of the pitch carbon-analysis test for 19 parts. Soak Time 0.580 0.660 0.660 0.660 0.660 0.660 1.000 1.170 1.170 1.170 Pitch 0.013 0.016 0.015 0.016 0.015 0.016 0.014 0.021 0.018 0.019 Soak Time 1.170 1.170 1.170 1.200 2.000 2.000 2.200 2.200 2.200 Pitch 0.021 0.019 0.021 0.025 0.025 0.026 0.024 0.025 0.024 The following tables are the incomplete Regression Analysis generated using Microsoft Excel: Regression Statistics Multiple R 0.87718225 R Square 0.76944871 Adjusted R Square 0.75588687 Standard Error 0.00212326 Observations 19 ANOVA df SS MS Significance F Regression 1 0.00025578 0.00025578 56.736303 ? Residual 17 7.664E-05 4.5082E-06 Total 18 0.00033242 Coefficients Standard Error t Stat P-value Lower 95% Upper 95% Intercept ? 0.001175 9.84103423 ? 0.00909025 0.01405162
Heat treating is often used to carburize metal parts such as gears. The thickness of the carburized layer is considered an important feature of the gear, and it contributes to the overall reliability of the part. Because of the critical nature of this feature, a lab test is performed on each furnace load. The test is a destructive one, where an actual part is cross sectioned and soaked in a chemical for a period of time. This test involves running a carbon analysis on the surface of both the gear pitch (top of the gear tooth) and the gear root (between the gear teeth). The data below are the results of the pitch carbon-analysis test for 19 parts. Soak Time 0.580 0.660 0.660 0.660 0.660 0.660 1.000 1.170 1.170 1.170 Pitch 0.013 0.016 0.015 0.016 0.015 0.016 0.014 0.021 0.018 0.019 Soak Time 1.170 1.170 1.170 1.200 2.000 2.000 2.200 2.200 2.200 Pitch 0.021 0.019 0.021 0.025 0.025 0.026 0.024 0.025 0.024 The following tables are the incomplete Regression Analysis generated using Microsoft Excel: Regression Statistics Multiple R 0.87718225 R Square 0.76944871 Adjusted R Square 0.75588687 Standard Error 0.00212326 Observations 19 ANOVA df SS MS Significance F Regression 1 0.00025578 0.00025578 56.736303 ? Residual 17 7.664E-05 4.5082E-06 Total 18 0.00033242 Coefficients Standard Error t Stat P-value Lower 95% Upper 95% Intercept ? 0.001175 9.84103423 ? 0.00909025 0.01405162

Big Ideas Math A Bridge To Success Algebra 1: Student Edition 2015
1st Edition
ISBN:9781680331141
Author:HOUGHTON MIFFLIN HARCOURT
Publisher:HOUGHTON MIFFLIN HARCOURT
Chapter11: Data Analysis And Displays
Section11.2: Box-and-whisker Plots
Problem 6E

Related questions
Question
48
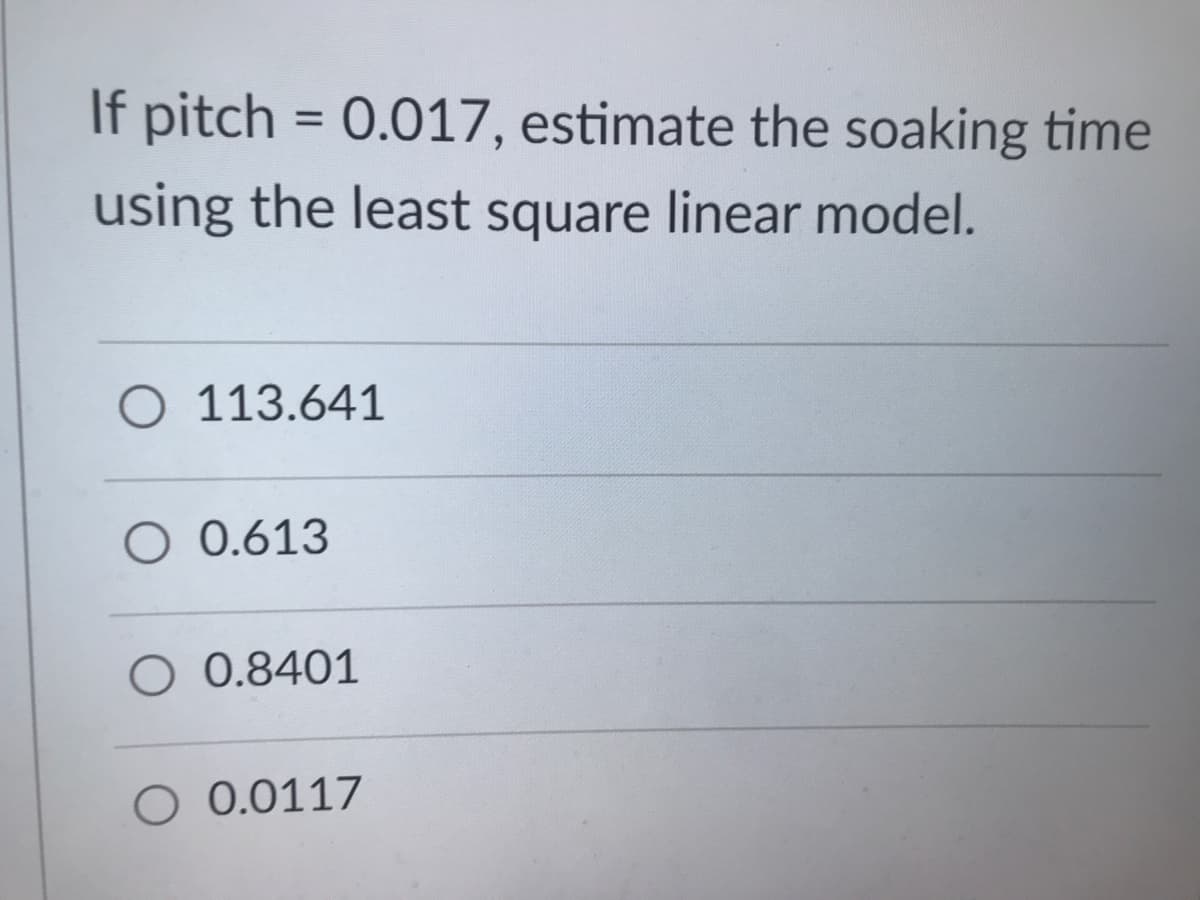
Transcribed Image Text:If pitch = 0.017, estimate the soaking time
using the least square linear model.
O 113.641
O 0.613
O 0.8401
O 0.0117
Transcribed Image Text:Heat treating is often used to carburize metal parts such as gears. The thickness of the carburized layer is considered an important feature of the gear, and it
contributes to the overall reliability of the part. Because of the critical nature of this feature, a lab test is performed on each furnace load. The test is a destructive
one, where an actual part is cross sectioned and soaked in a chemical for a period of time. This test involves running a carbon analysis on the surface of both the gear
pitch (top of the gear tooth) and the gear root (between the gear teeth). The data below are the results of the pitch carbon-analysis test for 19 parts.
Soak Time
0.580
0.660
0.660
0.660
0.660
0.660
1.000
1.170
1.170
1.170
Pitch
0.013
0.016
0.015
0.016
0.015
0.016
0.014
0.021
0.018
0.019
Soak Time
1.170
1.170
1.170
1.200
2.000
2.000
2.200
2.200
2.200
Pitch
0.021
0.019
0.021
0.025
0.025
0.026
0.024
0.025
0.024
The following tables are the incomplete Regression Analysis generated using Microsoft Excel:
Regression Statistics
Multiple R
0.87718225
R Square
0.76944871
Adjusted R Square
0.75588687
Standard Error
0.00212326
Observations
19
ANOVA
df
SS
MS
F
Significance F
Regression
1
0.00025578
0.00025578
56.736303
?
Residual
17
7.664E-05
4.5082E-06
Total
18
0.00033242
Coefficients
Standard Error
t Stat
P-value
Lower 95%
Upper 95%
Intercept
?
0.001175
9.84103423
?
0.00909025
0.01405162
Expert Solution
This question has been solved!
Explore an expertly crafted, step-by-step solution for a thorough understanding of key concepts.

This is a popular solution!

Trending now
This is a popular solution!

Step by step
Solved in 3 steps

Recommended textbooks for you
Big Ideas Math A Bridge To Success Algebra 1: Stu…
Algebra
ISBN:
9781680331141
Author:
HOUGHTON MIFFLIN HARCOURT
Publisher:
Houghton Mifflin Harcourt

Linear Algebra: A Modern Introduction
Algebra
ISBN:
9781285463247
Author:
David Poole
Publisher:
Cengage Learning
Big Ideas Math A Bridge To Success Algebra 1: Stu…
Algebra
ISBN:
9781680331141
Author:
HOUGHTON MIFFLIN HARCOURT
Publisher:
Houghton Mifflin Harcourt
Linear Algebra: A Modern Introduction
Algebra
ISBN:
9781285463247
Author:
David Poole
Publisher:
Cengage Learning