Square Footage, x 2251 3240 1137 1966 3001 2730 3998 2286 2734 1767 1869 3978 Selling Price ($000s), y 387.4 382.7 191.3 336.6 603.6 363.4 609.9 388.8 444.5 307.2 283.8 715.1
Square Footage, x 2251 3240 1137 1966 3001 2730 3998 2286 2734 1767 1869 3978 Selling Price ($000s), y 387.4 382.7 191.3 336.6 603.6 363.4 609.9 388.8 444.5 307.2 283.8 715.1

Holt Mcdougal Larson Pre-algebra: Student Edition 2012
1st Edition
ISBN:9780547587776
Author:HOLT MCDOUGAL
Publisher:HOLT MCDOUGAL
Chapter11: Data Analysis And Probability
Section11.2: Box-and-whisker Plots
Problem 2E

Related questions
Question
100%
(e) Find the least-squares regression line treating square footage as the explanatory variable.
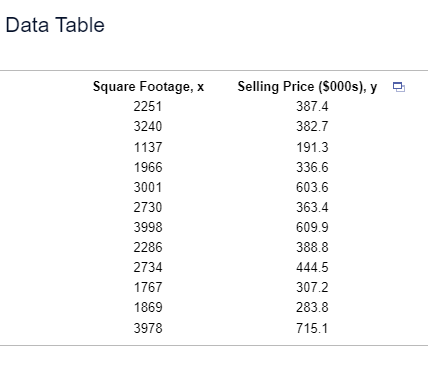
Transcribed Image Text:Data Table
Square Footage, x
2251
3240
1137
1966
3001
2730
3998
2286
2734
1767
1869
3978
Selling Price ($000s), y
387.4
382.7
191.3
336.6
603.6
363.4
609.9
388.8
444.5
307.2
283.8
715.1
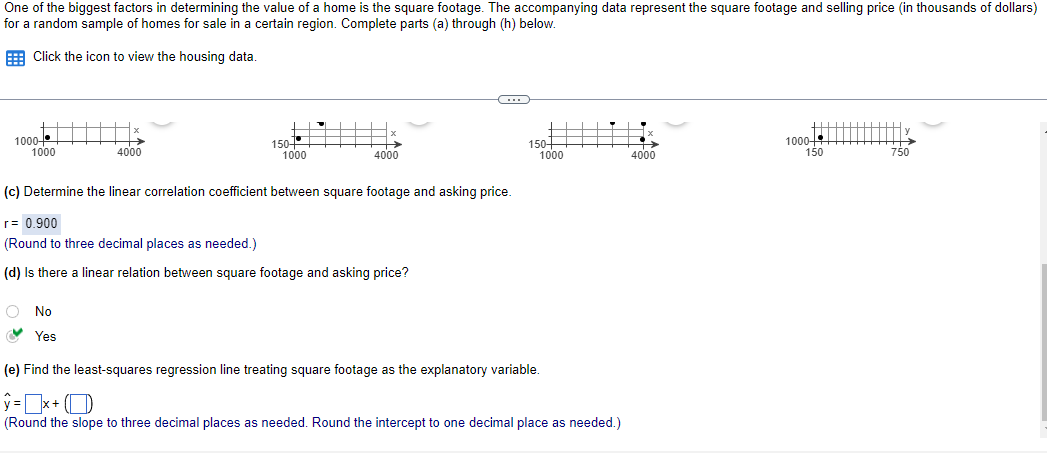
Transcribed Image Text:One of the biggest factors in determining the value of a home is the square footage. The accompanying data represent the square footage and selling price (in thousands of dollars)
for a random sample of homes for sale in a certain region. Complete parts (a) through (h) below.
Click the icon to view the housing data.
1000-
1000
O No
4000
Yes
150-
1000
4000
(c) Determine the linear correlation coefficient between square footage and asking price.
r= 0.900
(Round to three decimal places as needed.)
(d) Is there a linear relation between square footage and asking price?
C
150
1000
(e) Find the least-squares regression line treating square footage as the explanatory variable.
y=x+
(Round the slope to three decimal places as needed. Round the intercept to one decimal place as needed.)
4000
1000
150
750
Expert Solution
This question has been solved!
Explore an expertly crafted, step-by-step solution for a thorough understanding of key concepts.

Step by step
Solved in 4 steps with 1 images

Recommended textbooks for you
Holt Mcdougal Larson Pre-algebra: Student Edition…
Algebra
ISBN:
9780547587776
Author:
HOLT MCDOUGAL
Publisher:
HOLT MCDOUGAL

Glencoe Algebra 1, Student Edition, 9780079039897…
Algebra
ISBN:
9780079039897
Author:
Carter
Publisher:
McGraw Hill
Holt Mcdougal Larson Pre-algebra: Student Edition…
Algebra
ISBN:
9780547587776
Author:
HOLT MCDOUGAL
Publisher:
HOLT MCDOUGAL
Glencoe Algebra 1, Student Edition, 9780079039897…
Algebra
ISBN:
9780079039897
Author:
Carter
Publisher:
McGraw Hill