height of all the trees in the orchard is 120 inches cious that her uncle incorrectly recorded the mean ts of 40 trees in the orchard and finds a mean of = evel. What conclusion can Cheri draw at the end Here are some symbols you may wish to copy w
height of all the trees in the orchard is 120 inches cious that her uncle incorrectly recorded the mean ts of 40 trees in the orchard and finds a mean of = evel. What conclusion can Cheri draw at the end Here are some symbols you may wish to copy w

Glencoe Algebra 1, Student Edition, 9780079039897, 0079039898, 2018
18th Edition
ISBN:9780079039897
Author:Carter
Publisher:Carter
Chapter10: Statistics
Section10.3: Measures Of Spread
Problem 26PFA

Related questions
Question
It is a long question and both pictures are part of the same question though.
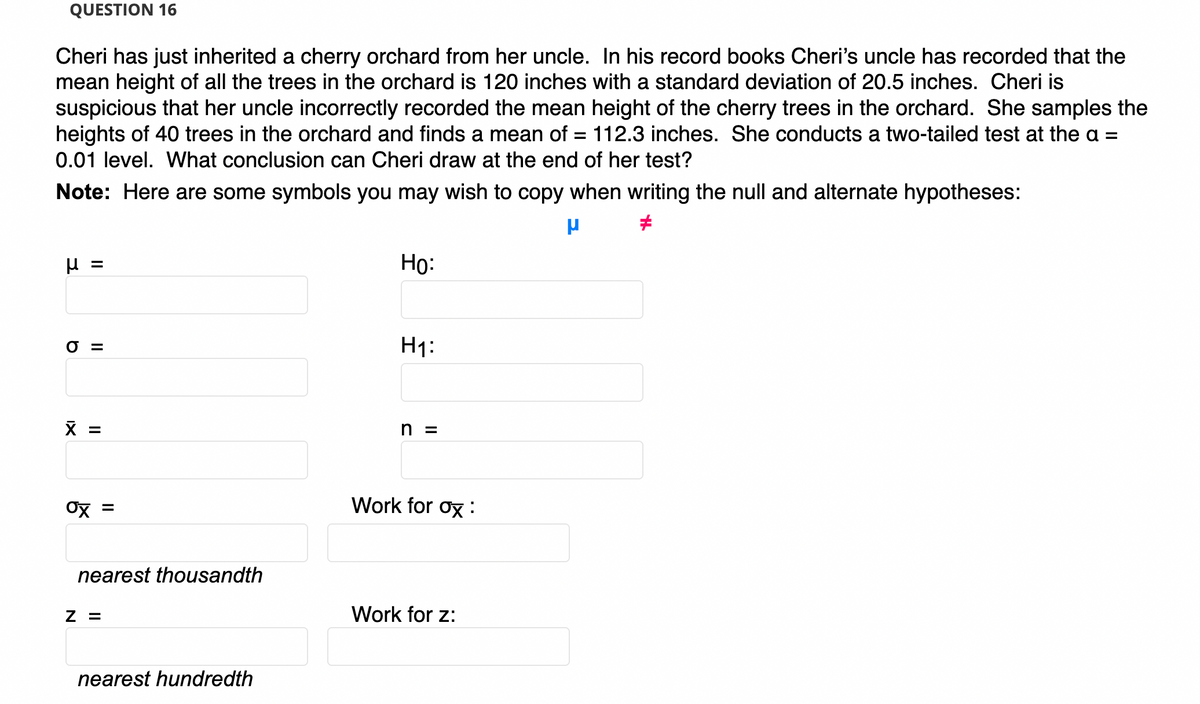
Transcribed Image Text:QUESTION 16
Cheri has just inherited a cherry orchard from her uncle. In his record books Cheri's uncle has recorded that the
mean height of all the trees in the orchard is 120 inches with a standard deviation of 20.5 inches. Cheri is
suspicious that her uncle incorrectly recorded the mean height of the cherry trees in the orchard. She samples the
heights of 40 trees in the orchard and finds a mean of = 112.3 inches. She conducts a two-tailed test at the a =
0.01 level. What conclusion can Cheri draw at the end of her test?
Note: Here are some symbols you may wish to copy when writing the null and alternate hypotheses:
=
Но:
O =
H1:
X =
h =
Ox
Work for ox :
nearest thousandth
Z =
Work for z:
nearest hundredth
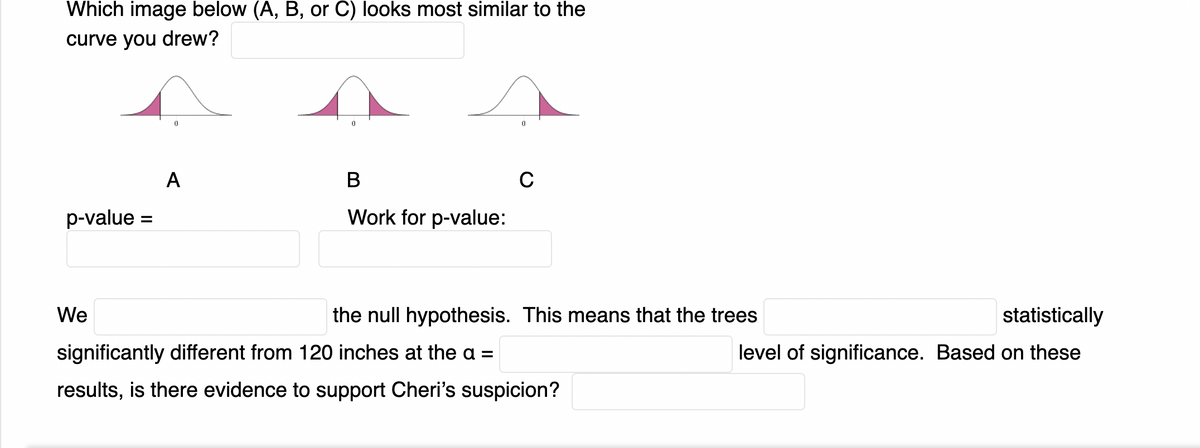
Transcribed Image Text:Which image below (A, B, or C) looks most similar to the
curve you drew?
A
B
C
p-value =
Work for p-value:
%3D
We
the null hypothesis. This means that the trees
statistically
significantly different from 120 inches at the a =
level of significance. Based on these
results, is there evidence to support Cheri's suspicion?
Expert Solution
This question has been solved!
Explore an expertly crafted, step-by-step solution for a thorough understanding of key concepts.

This is a popular solution!

Trending now
This is a popular solution!

Step by step
Solved in 3 steps with 2 images

Recommended textbooks for you
Glencoe Algebra 1, Student Edition, 9780079039897…
Algebra
ISBN:
9780079039897
Author:
Carter
Publisher:
McGraw Hill
Glencoe Algebra 1, Student Edition, 9780079039897…
Algebra
ISBN:
9780079039897
Author:
Carter
Publisher:
McGraw Hill