Height, x IQ score, y 62 111 60 105 66 111 68 117 60 99 64 113

Glencoe Algebra 1, Student Edition, 9780079039897, 0079039898, 2018
18th Edition
ISBN:9780079039897
Author:Carter
Publisher:Carter
Chapter10: Statistics
Section10.4: Distributions Of Data
Problem 19PFA

Related questions

Question
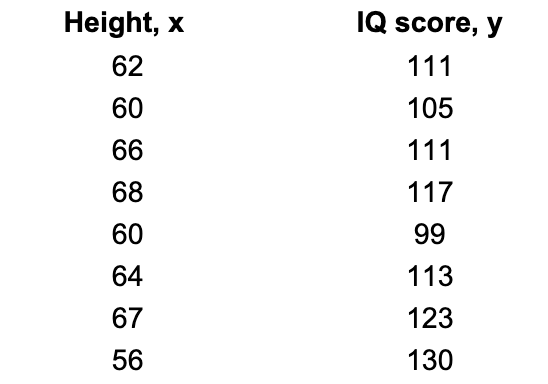
Transcribed Image Text:Height, x
IQ score, y
62
111
60
105
66
111
68
117
60
99
64
113
67
123
56
130
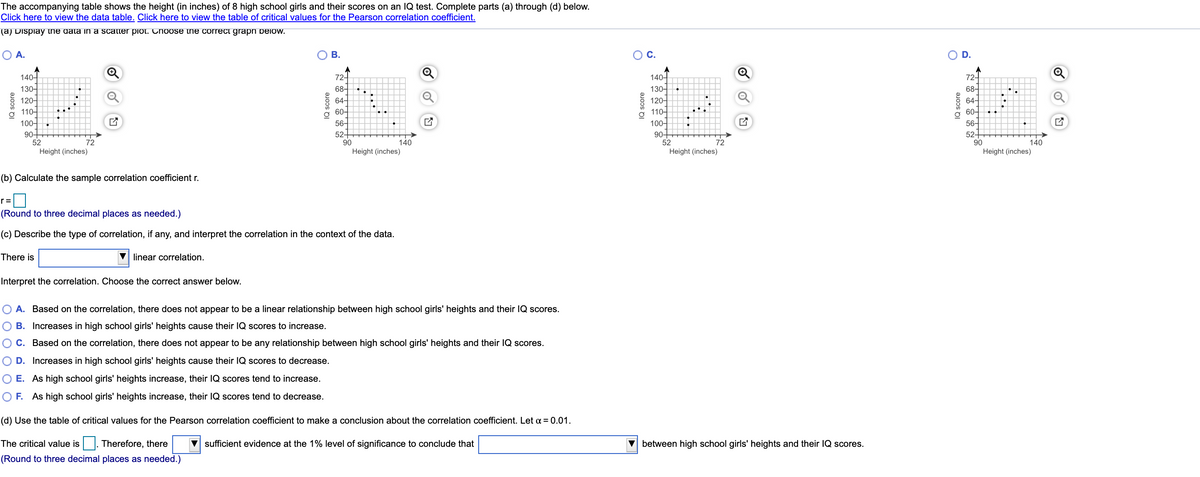
Transcribed Image Text:The accompanying table shows the height (in inches) of 8 high school girls and their scores on an IQ test. Complete parts (a) through (d) below.
Click here to view the data table. Click here to view the table of critical values for the Pearson correlation coefficient.
(a) Display tne data in a scatter piot. hoose the correct graph pelow.
O A.
о в.
O D.
Q
72-
68-
64-
72-
140-
130-
120-
140-
130-
120-
110-
100-
90+
52
Height (inches)
68-
64-
60-
56-
52+
90
110-
60-
100-
90+
52
Height (inches)
56-
52+
90
Height (inches)
72
140
72
140
Height (inches)
(b) Calculate the sample correlation coefficient r.
r=
(Round to three decimal places as needed.)
(c) Describe the type of correlation, if any, and interpret the correlation in the context of the data.
There is
V linear correlation.
Interpret the correlation. Choose the correct answer below.
O A. Based on the correlation, there does not appear to be a linear relationship between high school girls' heights and their lQ scores.
B. Increases in high school girls' heights cause their IQ scores to increase.
O C. Based on the correlation, there does not appear to be any relationship between high school girls' heights and their IQ scores.
O D. Increases in high school girls' heights cause their IQ scores to decrease.
O E. As high school girls' heights increase, their IQ scores tend to increase.
O F. As high school girls' heights increase, their IQ scores tend to decrease.
(d) Use the table of critical values for the Pearson correlation coefficient to make a conclusion about the correlation coefficient. Let a = 0.01.
The critical value is |. Therefore, there
V sufficient evidence at the 1% level of significance to conclude that
between high school girls' heights and their IQ scores.
(Round to three decimal places as needed.)
IQ score
IQ score
IQ score
C.
IQ score
Expert Solution
This question has been solved!
Explore an expertly crafted, step-by-step solution for a thorough understanding of key concepts.

This is a popular solution!

Trending now
This is a popular solution!

Step by step
Solved in 2 steps with 2 images

Knowledge Booster


Learn more about
Need a deep-dive on the concept behind this application? Look no further. Learn more about this topic, statistics and related others by exploring similar questions and additional content below.Recommended textbooks for you
Glencoe Algebra 1, Student Edition, 9780079039897…
Algebra
ISBN:
9780079039897
Author:
Carter
Publisher:
McGraw Hill

Holt Mcdougal Larson Pre-algebra: Student Edition…
Algebra
ISBN:
9780547587776
Author:
HOLT MCDOUGAL
Publisher:
HOLT MCDOUGAL
Glencoe Algebra 1, Student Edition, 9780079039897…
Algebra
ISBN:
9780079039897
Author:
Carter
Publisher:
McGraw Hill
Holt Mcdougal Larson Pre-algebra: Student Edition…
Algebra
ISBN:
9780547587776
Author:
HOLT MCDOUGAL
Publisher:
HOLT MCDOUGAL