Heights (cm) and weights (kg) are measured for 100 randomly selected adult males, and range from heights of 130 to 189 cm and weights of 40 to 150 kg. Let the predictor variable be the first variable given. The 100 paired measurements yield x = 167.08 cm, y=81.19 kg, r=0.133, P-value = 0.187, and y= -106 +1.12x. Find the best predicted value of y (weight) given an adult male who is 160 cm tall. Use a 0.05 significance level. Click the icon to view the critical values of the Pearson correlation coefficient r. The best predicted value of y for an adult male who is 160 cm tall is (Round to two decimal places as needed.) kg.
Heights (cm) and weights (kg) are measured for 100 randomly selected adult males, and range from heights of 130 to 189 cm and weights of 40 to 150 kg. Let the predictor variable be the first variable given. The 100 paired measurements yield x = 167.08 cm, y=81.19 kg, r=0.133, P-value = 0.187, and y= -106 +1.12x. Find the best predicted value of y (weight) given an adult male who is 160 cm tall. Use a 0.05 significance level. Click the icon to view the critical values of the Pearson correlation coefficient r. The best predicted value of y for an adult male who is 160 cm tall is (Round to two decimal places as needed.) kg.

College Algebra
7th Edition
ISBN:9781305115545
Author:James Stewart, Lothar Redlin, Saleem Watson
Publisher:James Stewart, Lothar Redlin, Saleem Watson
Chapter1: Equations And Graphs
Section: Chapter Questions
Problem 10T: Olympic Pole Vault The graph in Figure 7 indicates that in recent years the winning Olympic men’s...

Related questions
Question
7
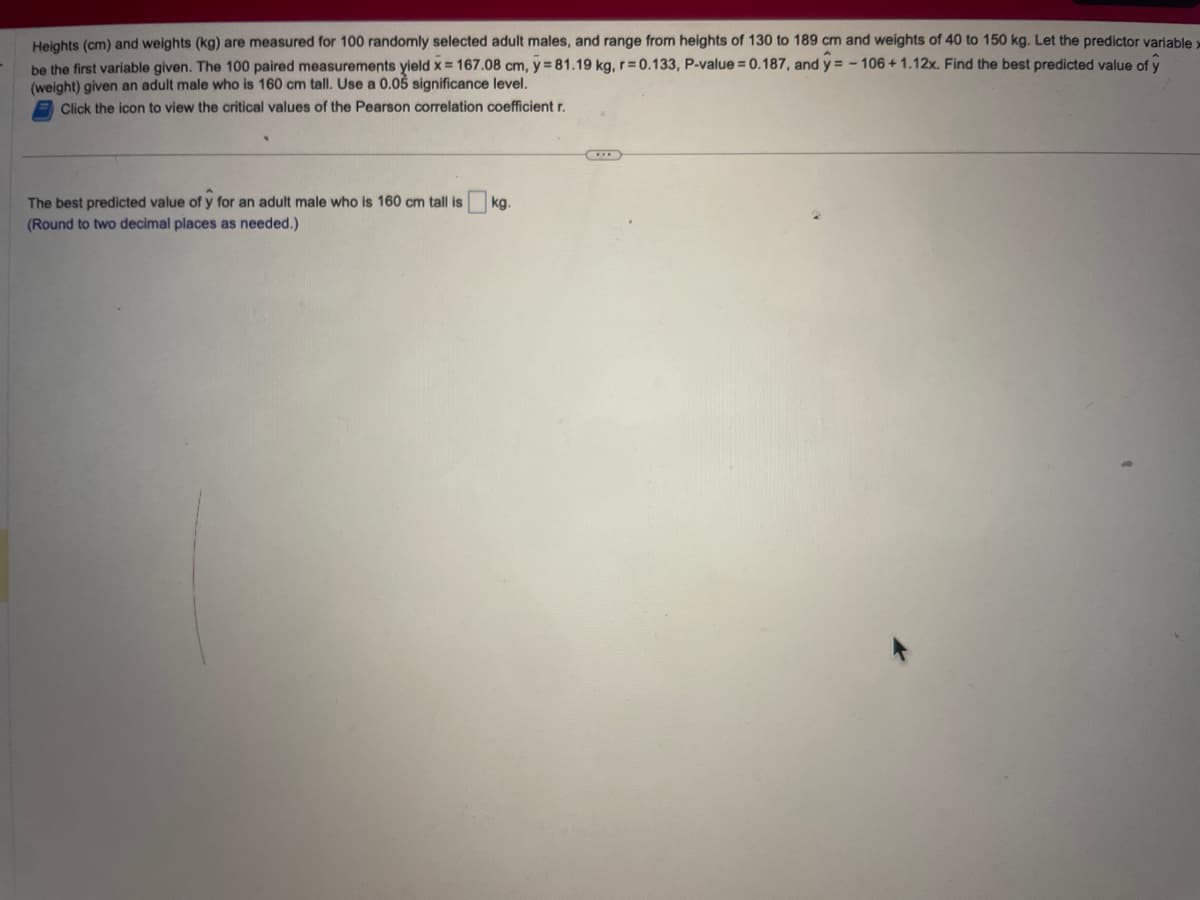
Transcribed Image Text:Heights (cm) and weights (kg) are measured for 100 randomly selected adult males, and range from heights of 130 to 189 cm and weights of 40 to 150 kg. Let the predictor variable x
be the first variable given. The 100 paired measurements yield x = 167.08 cm, y = 81.19 kg, r=0.133, P-value = 0.187, and y= -106 + 1.12x. Find the best predicted value of y
(weight) given an adult male who is 160 cm tall. Use a 0.05 significance level.
Click the icon to view the critical values of the Pearson correlation coefficient r.
The best predicted value of y for an adult male who is 160 cm tall is
(Round to two decimal places as needed.)
kg.
Transcribed Image Text:The best
(Round to
n
4
5
6
7
8
9
10
11
12
13
14
15
16
17
18
19
20
25
30
35
40
45
50
60
70
80
90
100
n
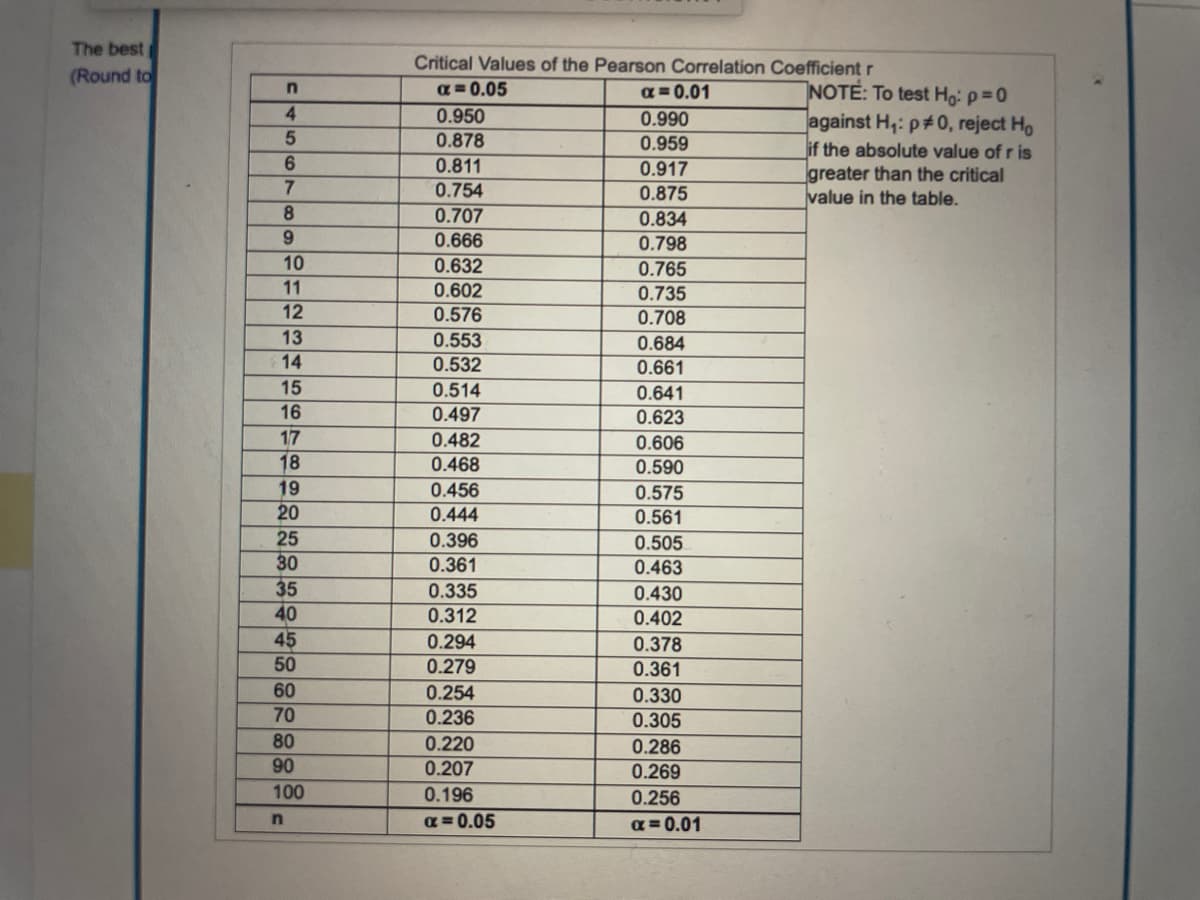
Critical Values of the Pearson Correlation Coefficient r
α=0.05
0.950
0.878
0.811
0.754
0.707
0.666
0.632
0.602
0.576
0.553
0.532
0.514
0.497
0.482
0.468
0.456
0.444
0.396
0.361
0.335
0.312
0.294
0.279
0.254
0.236
0.220
0.207
0.196
α=0.05
α=0.01
0.990
0.959
0.917
0.875
0.834
0.798
0.765
0.735
0.708
0.684
0.661
0.641
0.623
0.606
0.590
0.575
0.561
0.505
0.463
0.430
0.402
0.378
0.361
0.330
0.305
0.286
0.269
0.256
α = 0.01
NOTE: To test Ho: p=0
against H₁: p#0, reject Ho
if the absolute value of r is
greater than the critical
value in the table.
Expert Solution
This question has been solved!
Explore an expertly crafted, step-by-step solution for a thorough understanding of key concepts.

Step by step
Solved in 3 steps

Recommended textbooks for you
College Algebra
Algebra
ISBN:
9781305115545
Author:
James Stewart, Lothar Redlin, Saleem Watson
Publisher:
Cengage Learning

Linear Algebra: A Modern Introduction
Algebra
ISBN:
9781285463247
Author:
David Poole
Publisher:
Cengage Learning
College Algebra
Algebra
ISBN:
9781305115545
Author:
James Stewart, Lothar Redlin, Saleem Watson
Publisher:
Cengage Learning
Linear Algebra: A Modern Introduction
Algebra
ISBN:
9781285463247
Author:
David Poole
Publisher:
Cengage Learning