A real-estate agent conducted an experiment to test the effect of selling a staged home vs. selling an empty home. To do so, the agent obtained a list of 10 comparable homes just listed for sale that were currently empty. He randomly assigned 5 of the homes to be "staged," meaning filled with nice furniture and decorated. The owners of the 5 homes all agreed to have their homes staged by professional decorators. The other 5 homes remained empty. The hypothesis is that empty homes are not as appealing to buyers as staged homes and, therefore, sell for lower prices than staged homes. The mean selling price of the 5 empty homes was $150,000 with a standard deviation of $22,000. The mean selling price of the 5 staged homes was $175,000 with a standard deviation of 35,000. A dotplot of each sample shows no strong skewness and no outliers. The agent tests Ho: μ₁ −μ₂ = 0, Ha: H₁ - H₂ < 0, where H₁ = the true mean selling price of all comparable empty homes and μ₂ = the true mean selling price of all comparable staged homes. The conditions for inference are met. What are the values of the test statistic and P-value for a t-test about a difference in means? Find the t-table here. O t = - 150,000-175,000 22.000² 5 0.10 and 0.15. Ot= 35.000² 5 150,000 175,000 22,000² 35,000² 5 5 0.20 and 0.30. + .The P-value is between .The P-value is betweer


A real-estate agent conducted an experiment to test the effect of selling a staged home vs. selling an empty home. To do so, the agent obtained a list of 10 comparable homes just listed for sale that were currently empty. He randomly assigned 5 of the homes to be "staged,” meaning filled with nice furniture and decorated. The owners of the 5 homes all agreed to have their homes staged by professional decorators. The other 5 homes remained empty. The hypothesis is that empty homes are not as appealing to buyers as staged homes and, therefore, sell for lower prices than staged homes. The mean selling price of the 5 empty homes was $150,000 with a standard deviation of $22,000. The mean selling price of the 5 staged homes was $175,000 with a standard deviation of 35,000. A dotplot of each sample shows no strong skewness and no outliers.
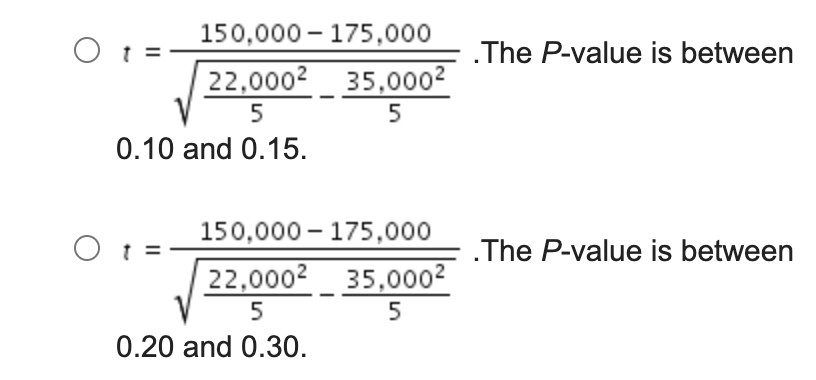
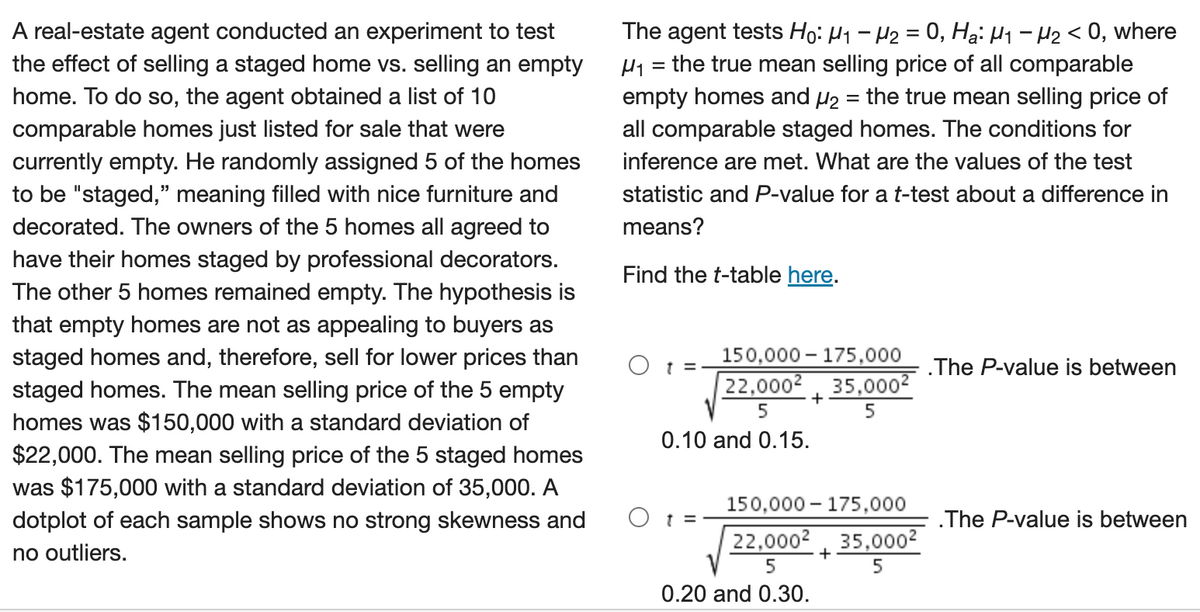
The agent tests H0: μ1 – μ2 = 0, Ha: μ1 – μ2 < 0, where μ1 = the true mean selling price of all comparable empty homes and μ2 = the true mean selling price of all comparable staged homes. The conditions for inference are met. What are the values of the test statistic and P-value for a t-test about a difference in means?
Find the t-table here.


Trending now
This is a popular solution!

Step by step
Solved in 3 steps with 11 images

