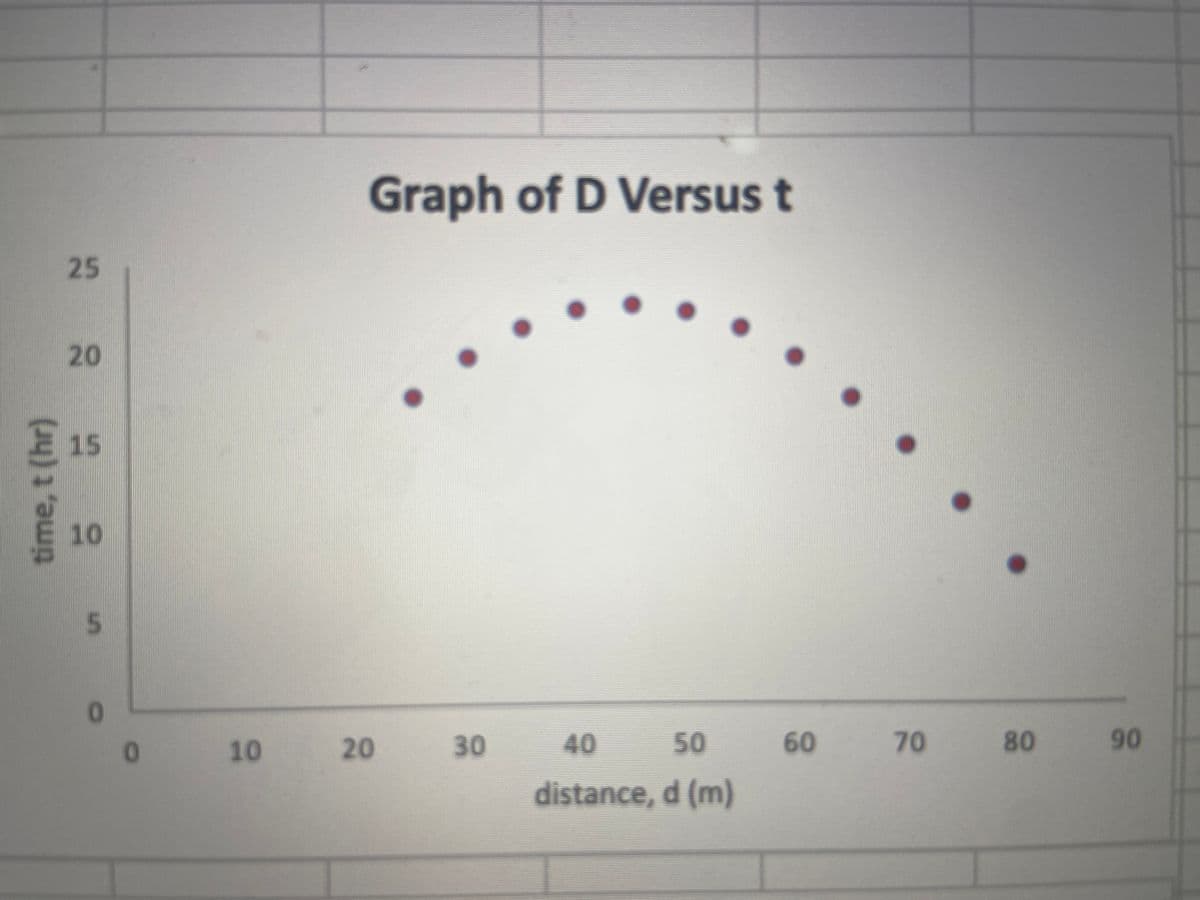
Hello! I would just like to ask help in interpreting this graph. Is this directly or inversely proportional and is is Linear or Non Linear? Does it have a positive or negative correlation? Please explain
Hello! I would just like to ask help in interpreting this graph. Is this directly or inversely proportional and is is Linear or Non Linear? Does it have a positive or negative correlation? Please explain
Algebra & Trigonometry with Analytic Geometry
13th Edition
ISBN:9781133382119
Author:Swokowski
Publisher:Swokowski
Chapter5: Inverse, Exponential, And Logarithmic Functions
Section5.3: The Natural Exponential Function
Problem 44E
Related questions
Question
Hello! I would just like to ask help in interpreting this graph. Is this directly or inversely proportional and is is Linear or Non Linear? Does it have a positive or

Transcribed Image Text:Graph of D Versus t
25
20
15
10
20
30
40
50
60
70
80
90
distance, d (m)
time, t (hr)
10
Expert Solution
This question has been solved!
Explore an expertly crafted, step-by-step solution for a thorough understanding of key concepts.
Step by step
Solved in 2 steps with 4 images

Recommended textbooks for you

Algebra & Trigonometry with Analytic Geometry
Algebra
ISBN:
9781133382119
Author:
Swokowski
Publisher:
Cengage

Algebra & Trigonometry with Analytic Geometry
Algebra
ISBN:
9781133382119
Author:
Swokowski
Publisher:
Cengage