Help me answer the following question in the pictures with the information below: Women athletes at a certain university have a long-term graduation rate of 67%. Over the past several years, a random sample of 36 women athletes at the school showed that 21 eventually graduated. Does this indicate that the population proportion of women athletes who graduate from the university is now less than 67%? Use a 10% level of significance.
Help me answer the following question in the pictures with the information below: Women athletes at a certain university have a long-term graduation rate of 67%. Over the past several years, a random sample of 36 women athletes at the school showed that 21 eventually graduated. Does this indicate that the population proportion of women athletes who graduate from the university is now less than 67%? Use a 10% level of significance.

College Algebra (MindTap Course List)
12th Edition
ISBN:9781305652231
Author:R. David Gustafson, Jeff Hughes
Publisher:R. David Gustafson, Jeff Hughes
Chapter8: Sequences, Series, And Probability
Section8.7: Probability
Problem 6E: List the sample space of each experiment. Tossing three coins

Related questions
Question
Help me answer the following question in the pictures with the information below:
Women athletes at a certain university have a long-term graduation rate of 67%. Over the past several years, a random sample of 36 women athletes at the school showed that 21 eventually graduated. Does this indicate that the population proportion of women athletes who graduate from the university is now less than 67%? Use a 10% level of significance.
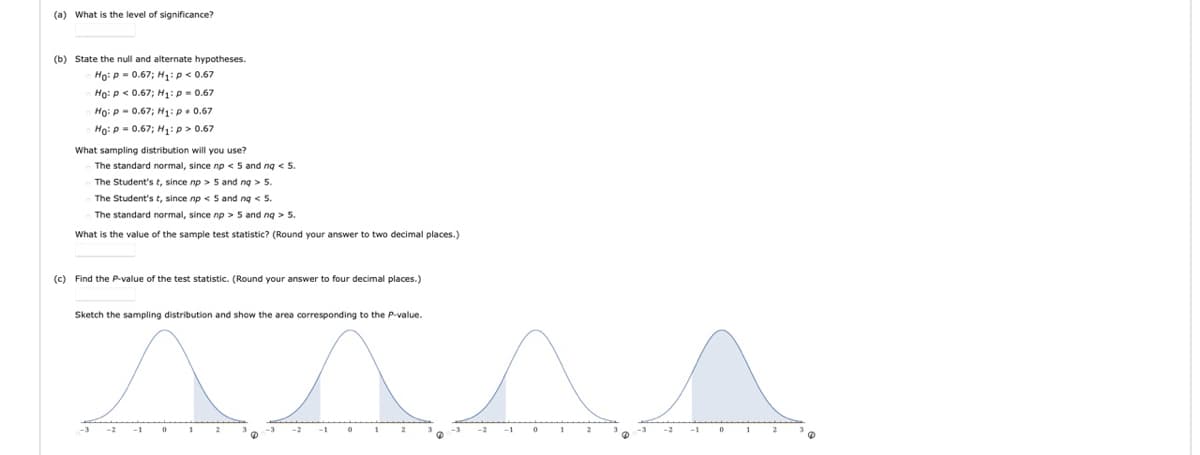
Transcribed Image Text:(a) What is the level of significance?
(b) State the null and alternate hypotheses.
Ho: p = 0.67; H1:p< 0.67
Họ: p < 0.67; H1:p = 0.67
Ho: P- 0.67; H:p. 0.67
Ho: p = 0.67; H:p> 0.67
What sampling distribution will you use?
The standard normal, since np < 5 and ng < 5.
The Student's t, since np > 5 and ng > 5.
The Student's t, since np < 5 and ng < 5.
The standard normal, since no > 5 and ng > 5.
What is the value of the sample test statistic? (Round your answer to two decimal places.)
(c) Find the P-value of the test statistic. (Round your answer to four decimal places.)
Sketch the sampling distribution and show the area corresponding to the P-value.
2
-2
2
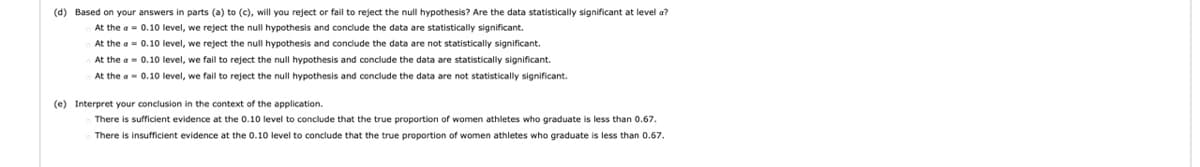
Transcribed Image Text:(d) Based on your answers in parts (a) to (c), will you reject or fail to reject the null hypothesis? Are the data statistically significant at level a?
At the a = 0.10 level, we reject the null hypothesis and conclude the data are statistically significant.
At the a = 0.10 level, we reject the null hypothesis and conclude the data are not statistically significant.
At the a = 0.10 level, we fail to reject the null hypothesis and conclude the data are statistically significant.
At the a- 0.10 level, we fail to reject the null hypothesis and conclude the data are not statistically significant.
(e) Interpret your conclusion in the context of the application.
There is sufficient evidence at the 0.10 level to conclude that the true proportion of women athletes who graduate is less than 0.67.
There is insufficient evidence at the 0.10 level to conclude that the true proportion of women athletes who graduate is less than 0.67.
Expert Solution
This question has been solved!
Explore an expertly crafted, step-by-step solution for a thorough understanding of key concepts.

Step by step
Solved in 2 steps with 2 images

Recommended textbooks for you
College Algebra (MindTap Course List)
Algebra
ISBN:
9781305652231
Author:
R. David Gustafson, Jeff Hughes
Publisher:
Cengage Learning

Holt Mcdougal Larson Pre-algebra: Student Edition…
Algebra
ISBN:
9780547587776
Author:
HOLT MCDOUGAL
Publisher:
HOLT MCDOUGAL
College Algebra (MindTap Course List)
Algebra
ISBN:
9781305652231
Author:
R. David Gustafson, Jeff Hughes
Publisher:
Cengage Learning
Holt Mcdougal Larson Pre-algebra: Student Edition…
Algebra
ISBN:
9780547587776
Author:
HOLT MCDOUGAL
Publisher:
HOLT MCDOUGAL