Help with F- Statistic and P-Value please!

Glencoe Algebra 1, Student Edition, 9780079039897, 0079039898, 2018
18th Edition
ISBN:9780079039897
Author:Carter
Publisher:Carter
Chapter4: Equations Of Linear Functions
Section: Chapter Questions
Problem 8SGR

Related questions

Question
100%
Help with F- Statistic and P-Value please!
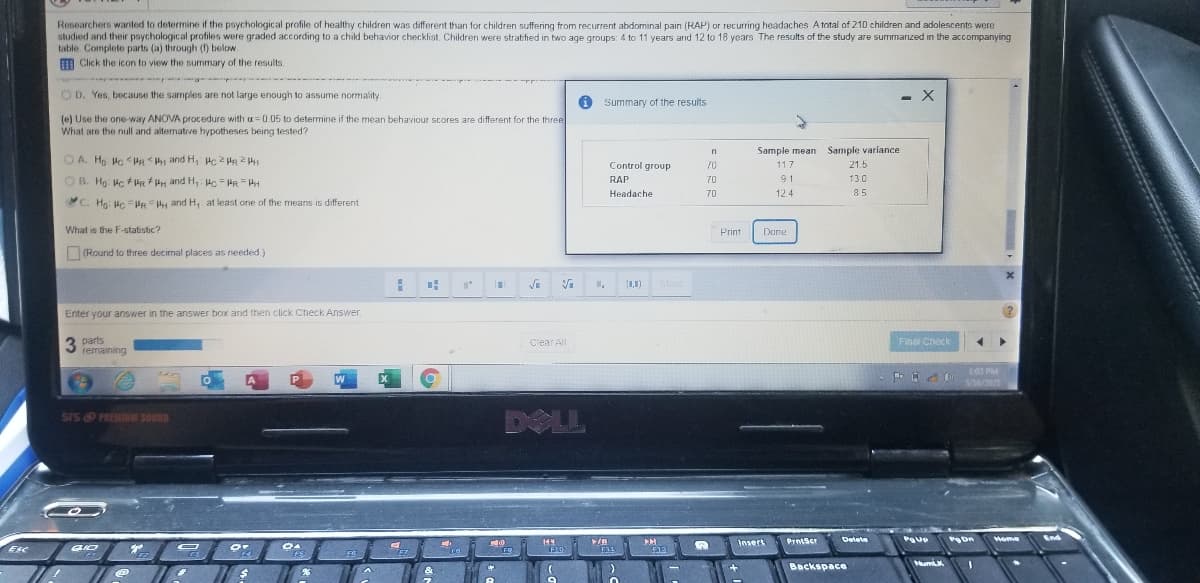
Transcribed Image Text:Researchers wanted to determine if the psychological profile of healthy children was different than for children suffering from recurrent abdominal pain (RAP) or recurring headaches A total of 210 children and adolescents were
studied and their psychological profiles were graded according to a child behavior checklist. Children were stratified in two age groups: 4 to 11 years and 12 to 18 years. The results of the study are summarized in the accompanying
table Complete parts (a) through (1) below.
m Click the icon to view the summary of the results.
O D. Yes, because the samples are not large enough to assume normality.
i summary of the results
(e) Use the one-way ANOVA procedure with =0.05 to determine if the mean behaviour scores are different for the three
What are the null and alternative hypotheses being tested?
Sample mean Sample variance
O A. Ho Hc <HR and H, Hc 2 HR 241
Control group
21.5
70
117
OB. Hg Hc + PR H and H, Hc = HR = HH
RAP
70
91
13.0
Headache
70
124
85
C. Hg: Hc PRH and H, at least one of the means is different
What is the F-statistic?
Print
Dane
(Round to three decirmal places as needed)
(1,1)
More
Enter your answer in the answer box and then click Check Answer.
3 parts
remaining
Clear All
Final Check
L43 PM
P
SA6/2021
DOLL
SIS PREMIUM SOUND
Delete
wome
End
Insert
PrniScr
Esc
FR
NumL
Backspace
&
Expert Solution
This question has been solved!
Explore an expertly crafted, step-by-step solution for a thorough understanding of key concepts.

Step by step
Solved in 2 steps with 6 images

Knowledge Booster


Learn more about
Need a deep-dive on the concept behind this application? Look no further. Learn more about this topic, statistics and related others by exploring similar questions and additional content below.Recommended textbooks for you
Glencoe Algebra 1, Student Edition, 9780079039897…
Algebra
ISBN:
9780079039897
Author:
Carter
Publisher:
McGraw Hill
Glencoe Algebra 1, Student Edition, 9780079039897…
Algebra
ISBN:
9780079039897
Author:
Carter
Publisher:
McGraw Hill