Here are the hottest recorded temperatures (in °F) for each of sixteen cities throughout North America. Temperatures (in °F) 111 112 103 107 102 93 100 94 98 108 106 108 101 97 95 103 (a) Complete the grouped frequency distribution for (b) Construct a histogram for the data. the data. (Note that the class width is 4.) Temperatures (in °F) 92.5-96.5 96.5-100.5 100.5-104.5 104.5-108.5 108.5-112.5 X Frequency Frequency 5 4- 3. 2 1 0 92.5 96.5 100.5 104.5 Temperatures (in °F) 108.5 112.5
Here are the hottest recorded temperatures (in °F) for each of sixteen cities throughout North America. Temperatures (in °F) 111 112 103 107 102 93 100 94 98 108 106 108 101 97 95 103 (a) Complete the grouped frequency distribution for (b) Construct a histogram for the data. the data. (Note that the class width is 4.) Temperatures (in °F) 92.5-96.5 96.5-100.5 100.5-104.5 104.5-108.5 108.5-112.5 X Frequency Frequency 5 4- 3. 2 1 0 92.5 96.5 100.5 104.5 Temperatures (in °F) 108.5 112.5

Glencoe Algebra 1, Student Edition, 9780079039897, 0079039898, 2018
18th Edition
ISBN:9780079039897
Author:Carter
Publisher:Carter
Chapter10: Statistics
Section10.6: Summarizing Categorical Data
Problem 42PFA

Related questions
Question
Transcribed Image Text:embrane Transport
Q
=
0
F1
O DESCRIPTIVE STATISTICS
Constructing a frequency distribution and a histogram
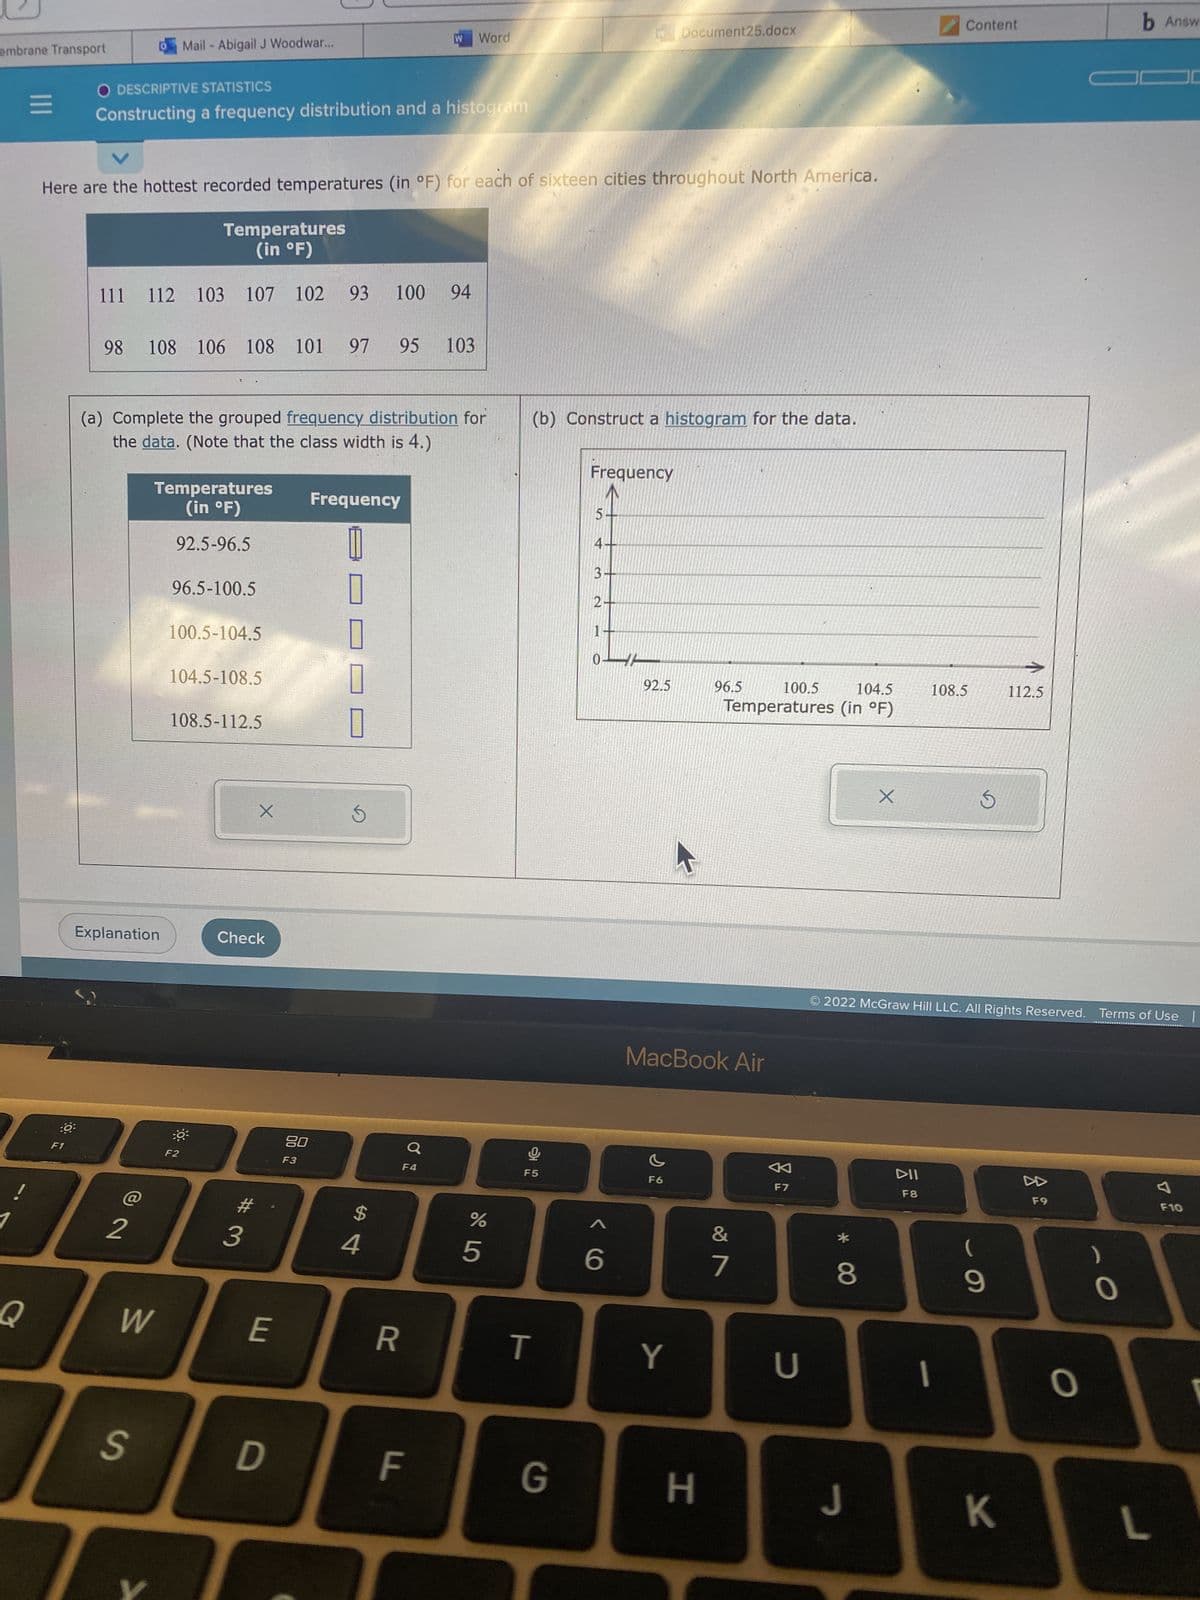
Here are the hottest recorded temperatures (in °F) for each of sixteen cities throughout North America.
Mail - Abigail J Woodwar...
Temperatures
(in °F)
111 112 103 107 102 93 100 94
98 108 106 108 101 97 95 103
(a) Complete the grouped frequency distribution for
the data. (Note that the class width is 4.)
Explanation
@
W
Temperatures
(in °F)
92.5-96.5
S
96.5-100.5
100.5-104.5
104.5-108.5
108.5-112.5
X
Check
E
80
F3
D
Frequency
#
234
300
U
0
Ś
W Word
$
R
F4
LL
%
5
(b) Construct a histogram for the data.
21
F5
T
G
Frequency
5.
4-
3.
2
1
0
6
92.5
Document25.docx
F6
Y
MacBook Air
96.5
H
100.5
104.5
Temperatures (in °F)
&
7
F7
U
8
X
J
DII
F8
Content
108.5
© 2022 McGraw Hill LLC. All Rights Reserved. Terms of Use |
1
S
(
9
112.5
K
F9
O
b Answ
O
L
F10
Expert Solution
This question has been solved!
Explore an expertly crafted, step-by-step solution for a thorough understanding of key concepts.

This is a popular solution!

Trending now
This is a popular solution!

Step by step
Solved in 4 steps with 2 images

Recommended textbooks for you
Glencoe Algebra 1, Student Edition, 9780079039897…
Algebra
ISBN:
9780079039897
Author:
Carter
Publisher:
McGraw Hill
Glencoe Algebra 1, Student Edition, 9780079039897…
Algebra
ISBN:
9780079039897
Author:
Carter
Publisher:
McGraw Hill