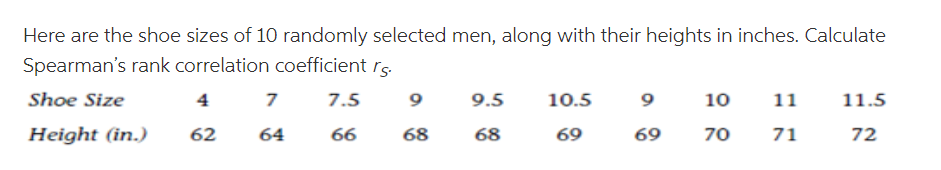
Here are the shoe sizes of 10 randomly selected men, along with their heights in inches. Calculate Spearman's rank correlation coefficient rs. Shoe Size 7.5 9 9.5 10.5 10 11 11.5 Height (in.) 62 64 66 68 68 69 69 70 71 72
Q: ntary running wheel) on time spent in a target quadrant (more time indicates better memory). I…
A: Control Diet High-sugar High-fat No Exercise 15 24 19 28 20 23 29 30 22 30 32 23…
Q: Cash flow and profits are both crucial aspects of a business. Profit is the surplus revenue after…
A: Given information: x = 104 n = 199 p^=xn=104199=0.522613065≈0.5226 Note: As per guidelines we will…
Q: You have been wondering whether the attention span of your classmates have gotten shorter because of…
A: Given information: Variable of interest: The attention span of students In group A, No. of…
Q: 2- A radio station conducts a poll about gun control. It invites listeners to call one phone number…
A: Random sampling: A simple random sample of size n is collected from a large population where each…
Q: 5. To check the spread of disease of a salmon at a fish farm in BC the manager wants to inspect 10%…
A: Manager wants to inspect 10 % of fish in farm. We have to find out sampling technique for each…
Q: ANSWER THE FOLLOWING PROBLEMS SHOWING COMPLETE SOLUTION ENCLOSE FINAL ANSWER THANK YOU! topic POINT…
A: A type I error occurred when the null hypo. is rejected when in reality it is true. A type II error…
Q: Find the (a) mean, (b) median, (c) mode, and (d) midrange for the data and then (e) answer the given…
A: Given For 16) n=11 For 17) Z=-1.73
Q: Two six-sided dice are rolled and the random variable x is the sum of the values produced by each…
A: The question is based on calculating expected value , variance using probability dist. Given : Two…
Q: 92 83 80 85 82 78 Degrees of freedom (from calculation or Jamovi): ____________ Critical…
A:
Q: The following is the simple regression results based on the data from Madrigal Corporation:…
A: From the given information, Intercept=P 3500 Coefficient of independent variable is P 3.50…
Q: 2. For each of the following problems: 1) Indicate which measure/s of morbidity (prevalence,…
A: Morbidity frequency measures the number of people in a population who get sick (incidence) or are…
Q: 2) Fit a straight line to the data shown below using least squares method and compute the standard…
A: We need to fit a straight line to the data given using least squares method and compute the standard…
Q: Consider the game in strategic form defined by the following payoff functions: U1(t1,t2) = [10 +…
A:
Q: The probability density of a random variable X is given in the figure below. 1 2 From this density,…
A: Given X>1.78 X<0.02
Q: The tabie available below is the trequency distribution tor cata of the verbal 1Q scores for a group…
A: Introduction: The grouped frequency distribution of verbal IQ scores is given.
Q: I’m interested in assessing whether someone’s resting heart rate (X) is related to how fast they are…
A: The independent variable is Resting Heart Rate. The dependent variable is Finish Time. We have to…
Q: 3. MAKE A NEWTON'S DIVIDED DIFFERENCE TABLE TO (a) FIND FOR THE FUNCTION f,(x) THAT WILL SATISFY THE…
A: We need to make a Newton's divided difference table to find: (a) the function f(x) (b) f(4) and…
Q: Which among the groups is most dispersed? Support your answer.
A: here Given mean and standard deviation of different group
Q: The histogram to the right represents the sepal widths (mm) of a sample of irises. 30- What is the…
A: The frequency histogram of the sepal widths is given.
Q: The hypothesis test H0:μ=176.6 H1:μ≠176.6 is to be carried out for a population where ?σ is not…
A:
Q: ample 8.1(). A computer while calculating correlation coefficient between two variables X and Y from…
A: Given that We have to find the corrected correlation coefficient...
Q: g. By caleulator, find and label, the 5-number summary of the Natural Gas Price in $ per Million…
A: Note: "Since you have posted a question with multiple sub -parts, we will solve first three sub…
Q: Each person in a random sample of 234 residents in a major town was asked whether they had ever been…
A:
Q: 2) Fit a straight line to the data shown below using least squares method and compute the standard…
A: We need to fit a straight line to the given data using least squares method and compute the standard…
Q: Calculate this z test statistic and enter your answer, correct to 3 decimal places, into the box…
A: The z-test is conducted to test significant difference in proportions between two large populations.
Q: Given the following pair of scores in x and y. compute and interpret r. Use formula 1, 2, 3, and 4.…
A: For the given data Fons r =? and interpret
Q: ns with the same mean. Do the amounts of arseni ve the highest mean, can we conclude that brown k…
A: Given, Arkansas California Texas 4.84 1.45 5.55 4.87 3.7 5.81 5.02 3.96 6.62 5.41 4.47…
Q: children at a local elementary school. The results are shown in the table below (image) : a. State…
A:
Q: What is the value of k? What is the standard deviation?
A: Here use basic of discrete probability distribution
Q: A factory owner wants to estimate the average hours lost due to a machine breakdown. Recording for…
A: Given: Sample size, n=9Sample mean, x¯=3.5Sample sd, s=1.5Confidence level=98%
Q: Construct a labelled box plot and state the type of skew of the following data…
A: Given n=13
Q: Listed below are the measured radiation absorption rates (in W/kg) corresponding to 11 cell phones.…
A:
Q: Identify the class width, class midpoints, and class boundaries for the given frequency…
A: The question is based on a frequency dist. Given :
Q: Listed below are blood platelet counts (1000 cells/uL) randomly selected from adults in the United…
A: Histogram is the graphical presentation of statistical data Histogram is commonly used graph to…
Q: Use the given data to find the equation of the regression line. Examine the scatterplot and identify…
A: For the given data Find the regression line Select the correct choice
Q: Suppose that you are to conduct the following hypothesis test: H0:μ≤8 H1:μ>8 A sample of 15…
A:
Q: Identify each data as either nominal, ordinal, ratio or interval. Social Security System (SSS)…
A: Given to classify each data as either nominal, ordinal, ratio or interval. Social Security System…
Q: Assume that a normal distribution of data has a mean of 18 and a standard deviation of 4 Use the…
A:
Q: Here are summary statistics for randomly selected weights of newborn girls: n= 232, *= 32.2 hg,…
A: Given n=232 Mean=32.2 Standard deviations=7.4
Q: IV: Drug Treatment DV: perceived level of happiness Is there a significant difference between…
A: Given: Person Placebo Drug A Drug B Drug C A 3 4 6 7 B 0 3 3 6 C 2 1 4 5 D 0 1 3 4 E 0…
Q: The graph illustrates a normal distribution for the prices paid for a particular model of HD…
A: We have given that, From the normal curve, Population mean (μ) = 1600 and standard deviation (σ) =…
Q: Scenario: Is there a relationship between worker type (X) and productivity (Y)? The researcher…
A: It is needed to determine the level of measurement of the data.
Q: group took 40 mg of ginkgo 3 times a day for 6 weeks. The 115 participants assigned to the control…
A:
Q: A family of sampling methods where the results obtained from the sample can be projected onto the…
A: In the given problem we have to answer, A family of sampling methods where the results obtained from…
Q: of 232.3-cm and a standard deviation of 1.6-cm. For shipment, 21 steel rods are bundled together.…
A: Given Data : Population Mean,μ = 232.3 Population Standard Deviation,σ = 1.6 sample size…
Q: Compute E(y6) for the following model, where e ~ wn(0,0.01), i.e., a white noise process with mean…
A:
Q: The following data shows the height function of a hill a a distance x from a reference. Form a cubic…
A: Given Information: Consider the given data: x h 0 4 1 5 2 10 3 17 4 21 5 16 6 11…
Q: When α = .10, what is the rejection region that should be used to test H_0:σ1/2=σ2/2 against…
A: From the above data we are given that the hypothesis H0 : σ21=σ22 H1 : σ12 > σ22
Q: Consider a hypothesis test to decide if the mean yield of cotton in a certain region is less than 1…
A: Given that . "The mean cotton yield in the region is actually less than 1 ton per acre and the…
Q: . Two soft drink dispensing machines should dispense 8 oz of your selection into a cup. The table…
A: Two measures of dispersion variance and range has compared.
Trending now
This is a popular solution!
Step by step
Solved in 2 steps