The tabie available below is the trequency distribution tor cata of the verbal 1Q scores for a group af children with iow levels of measured lead in their biood. Use the trequency distribution to construct a nistogram Use ciass midpoint values for the horzontai scale. Do the la scores acpear to have a nomal distroution? E Click the icon to view he frequency distribution of the verbal 1a scores. Which histogram below shows! data? Frequency Distribution of Verbal IQ Scores OA OB. KO Verbal) Frequency 50-59 60-69 70-79 00-09 sis is 74s sis is 1045 1145 1245 545 45 74S 4S 4s 1045 1145 1245 11 Oc. OD. 90-99 100-100 120-12 Print Done Since the histogram has the la scores to have a distribution that is appraimately nomal.
The tabie available below is the trequency distribution tor cata of the verbal 1Q scores for a group af children with iow levels of measured lead in their biood. Use the trequency distribution to construct a nistogram Use ciass midpoint values for the horzontai scale. Do the la scores acpear to have a nomal distroution? E Click the icon to view he frequency distribution of the verbal 1a scores. Which histogram below shows! data? Frequency Distribution of Verbal IQ Scores OA OB. KO Verbal) Frequency 50-59 60-69 70-79 00-09 sis is 74s sis is 1045 1145 1245 545 45 74S 4S 4s 1045 1145 1245 11 Oc. OD. 90-99 100-100 120-12 Print Done Since the histogram has the la scores to have a distribution that is appraimately nomal.

Glencoe Algebra 1, Student Edition, 9780079039897, 0079039898, 2018
18th Edition
ISBN:9780079039897
Author:Carter
Publisher:Carter
Chapter10: Statistics
Section10.4: Distributions Of Data
Problem 22PFA

Related questions
Question
47
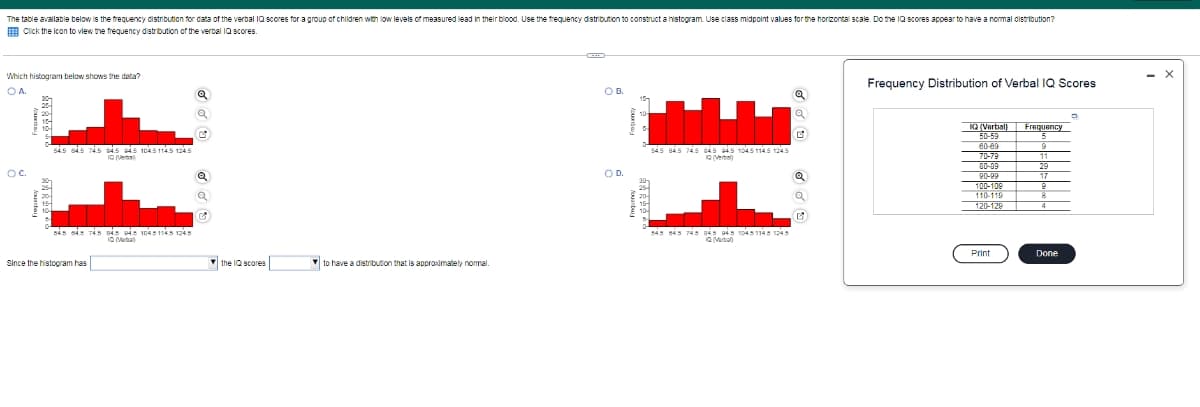
Transcribed Image Text:The table avallable below is the ftrequency distribution for data of the verbal 1Q scores for a grouo of children with low levels of measured lead in their blood. Use the frequency distribution to construct a histogram. Use class midooint values for the horigontal scale, Do the IQ scores acpear to have a nomal distribution?
E Click the icon to view the frequency distribution of the verbal IQ scores.
Which histogram below shows the data?
Frequency Distribution of Verbal IQ Scores
OA.
OB.
K2 (Varbal) Frequency
50-59
80-69
s4s eis 74s s4s is 1045 1145 1245
IO Ners
545 845 745 845 045 1045 1145 1245
1Q Vertal
Oc.
OD.
80-98
110-119
120-129
s45 sis ris s is 1045 1145 1245
s4s s45 74s s45 B45 10451145 1245
Print
Done
Since the histogram has
the 1Q scores
v to have a distribution that is approximately nomal.
Expert Solution
This question has been solved!
Explore an expertly crafted, step-by-step solution for a thorough understanding of key concepts.

Step by step
Solved in 2 steps with 1 images

Recommended textbooks for you
Glencoe Algebra 1, Student Edition, 9780079039897…
Algebra
ISBN:
9780079039897
Author:
Carter
Publisher:
McGraw Hill

Big Ideas Math A Bridge To Success Algebra 1: Stu…
Algebra
ISBN:
9781680331141
Author:
HOUGHTON MIFFLIN HARCOURT
Publisher:
Houghton Mifflin Harcourt
Glencoe Algebra 1, Student Edition, 9780079039897…
Algebra
ISBN:
9780079039897
Author:
Carter
Publisher:
McGraw Hill
Big Ideas Math A Bridge To Success Algebra 1: Stu…
Algebra
ISBN:
9781680331141
Author:
HOUGHTON MIFFLIN HARCOURT
Publisher:
Houghton Mifflin Harcourt