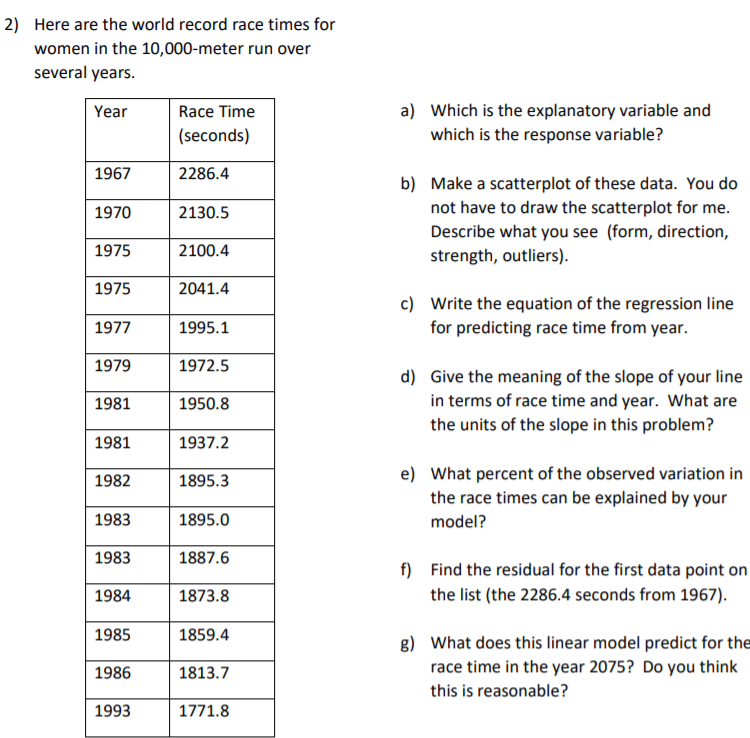
Here are the world record race times for women in the 10,000-meter run over several years. a) Which is the explanatory variable and which is the response variable? Year Race Time (seconds) 1967 2286.4 b) Make a scatterplot of these data. You do not have to draw the scatterplot for me. Describe what you see (form, direction, 1970 2130.5 1975 2100.4 strength, outliers). 1975 2041.4 c) Write the equation of the regression line for predicting race time from year. 1977 1995.1 1979 1972.5 d) Give the meaning of the slope of your line in terms of race time and year. What are the units of the slope in this problem? 1981 1950.8 1981 1937.2 e) What percent of the observed variation in 1982 1895.3 the race times can be explained by your 1983 1895.0 model? 1983 1887.6 f) Find the residual for the first data point or 1984 1873.8 the list (the 2286.4 seconds from 1967). 1985 1859.4 g) What does this linear model predict for th race time in the year 2075? Do you think 1986 1813.7 this is reasonable? 1993 1771.8


Inverse Normal Distribution
The method used for finding the corresponding z-critical value in a normal distribution using the known probability is said to be an inverse normal distribution. The inverse normal distribution is a continuous probability distribution with a family of two parameters.
Mean, Median, Mode
It is a descriptive summary of a data set. It can be defined by using some of the measures. The central tendencies do not provide information regarding individual data from the dataset. However, they give a summary of the data set. The central tendency or measure of central tendency is a central or typical value for a probability distribution.
Z-Scores
A z-score is a unit of measurement used in statistics to describe the position of a raw score in terms of its distance from the mean, measured with reference to standard deviation from the mean. Z-scores are useful in statistics because they allow comparison between two scores that belong to different normal distributions.


Trending now
This is a popular solution!

Step by step
Solved in 3 steps with 5 images


