(a) In Data 7A, the "subjects" of the research are not indi- viduals, but rather what? (b) Make a scatter diagram of these data. (c) In words, describe the relationship between the two variables. (d) Estimate the correlation coefficient. (e) Calcu- late r.
(a) In Data 7A, the "subjects" of the research are not indi- viduals, but rather what? (b) Make a scatter diagram of these data. (c) In words, describe the relationship between the two variables. (d) Estimate the correlation coefficient. (e) Calcu- late r.

Linear Algebra: A Modern Introduction
4th Edition
ISBN:9781285463247
Author:David Poole
Publisher:David Poole
Chapter4: Eigenvalues And Eigenvectors
Section4.6: Applications And The Perron-frobenius Theorem
Problem 25EQ

Related questions
Question
I was really confused on calculating r, but if two other questions could also be answered in this problem, it would be the most help.
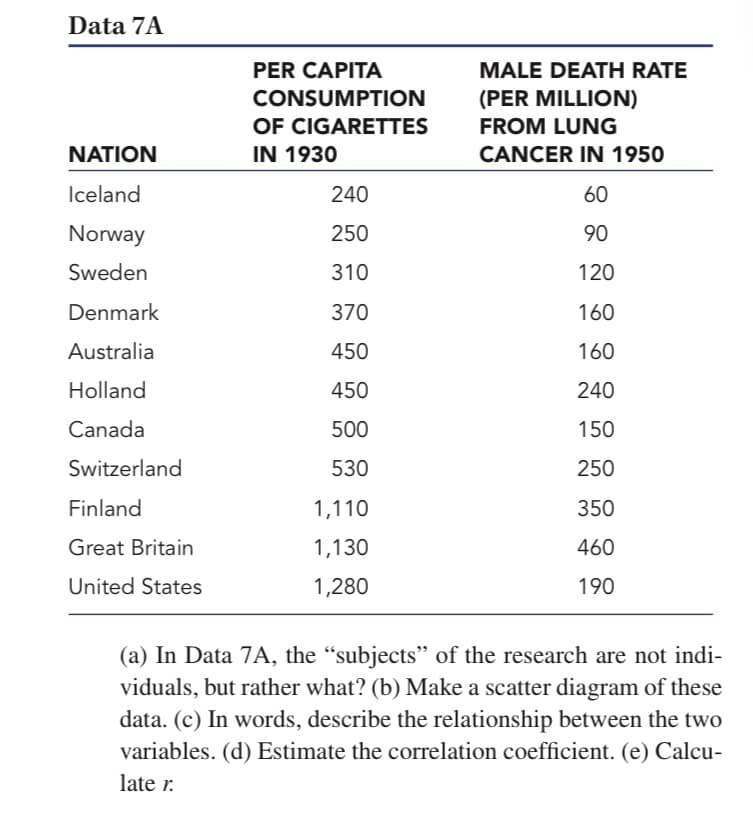
Transcribed Image Text:Data 7A
PER CAPITA
MALE DEATH RATE
CONSUMPTION
(PER MILLION)
FROM LUNG
OF CIGARETTES
NATION
IN 1930
CANCER IN 1950
Iceland
240
60
Norway
250
90
Sweden
310
120
Denmark
370
160
Australia
450
160
Holland
450
240
Canada
500
150
Switzerland
530
250
Finland
1,110
350
Great Britain
1,130
460
United States
1,280
190
(a) In Data 7A, the "subjects" of the research are not indi-
viduals, but rather what? (b) Make a scatter diagram of these
data. (c) In words, describe the relationship between the two
variables. (d) Estimate the correlation coefficient. (e) Calcu-
late r.
Expert Solution
This question has been solved!
Explore an expertly crafted, step-by-step solution for a thorough understanding of key concepts.

This is a popular solution!

Trending now
This is a popular solution!

Step by step
Solved in 3 steps with 1 images

Knowledge Booster


Learn more about
Need a deep-dive on the concept behind this application? Look no further. Learn more about this topic, statistics and related others by exploring similar questions and additional content below.Recommended textbooks for you
Linear Algebra: A Modern Introduction
Algebra
ISBN:
9781285463247
Author:
David Poole
Publisher:
Cengage Learning

Elementary Linear Algebra (MindTap Course List)
Algebra
ISBN:
9781305658004
Author:
Ron Larson
Publisher:
Cengage Learning
Linear Algebra: A Modern Introduction
Algebra
ISBN:
9781285463247
Author:
David Poole
Publisher:
Cengage Learning
Elementary Linear Algebra (MindTap Course List)
Algebra
ISBN:
9781305658004
Author:
Ron Larson
Publisher:
Cengage Learning