Here is a bivariate data set. y 48.1 27.5 68.3 74.8 59.4 45.5 68.2 83.5 77.5 88.1 76.1 83.6 71 76.3 53.8 52 89.2 108.8 76.6 101 76.7 70.3 80.1 91.6 75.3 87.1 62.5 70.8 Find the correlation coefficient and report it accurate to three decimal places. What proportion of the variation in y can be explained by the variation in the values of x? Report answer as a percentage accurate to one decimal place. %
Here is a bivariate data set. y 48.1 27.5 68.3 74.8 59.4 45.5 68.2 83.5 77.5 88.1 76.1 83.6 71 76.3 53.8 52 89.2 108.8 76.6 101 76.7 70.3 80.1 91.6 75.3 87.1 62.5 70.8 Find the correlation coefficient and report it accurate to three decimal places. What proportion of the variation in y can be explained by the variation in the values of x? Report answer as a percentage accurate to one decimal place. %

Glencoe Algebra 1, Student Edition, 9780079039897, 0079039898, 2018
18th Edition
ISBN:9780079039897
Author:Carter
Publisher:Carter
Chapter4: Equations Of Linear Functions
Section4.5: Correlation And Causation
Problem 23PFA

Related questions
Question
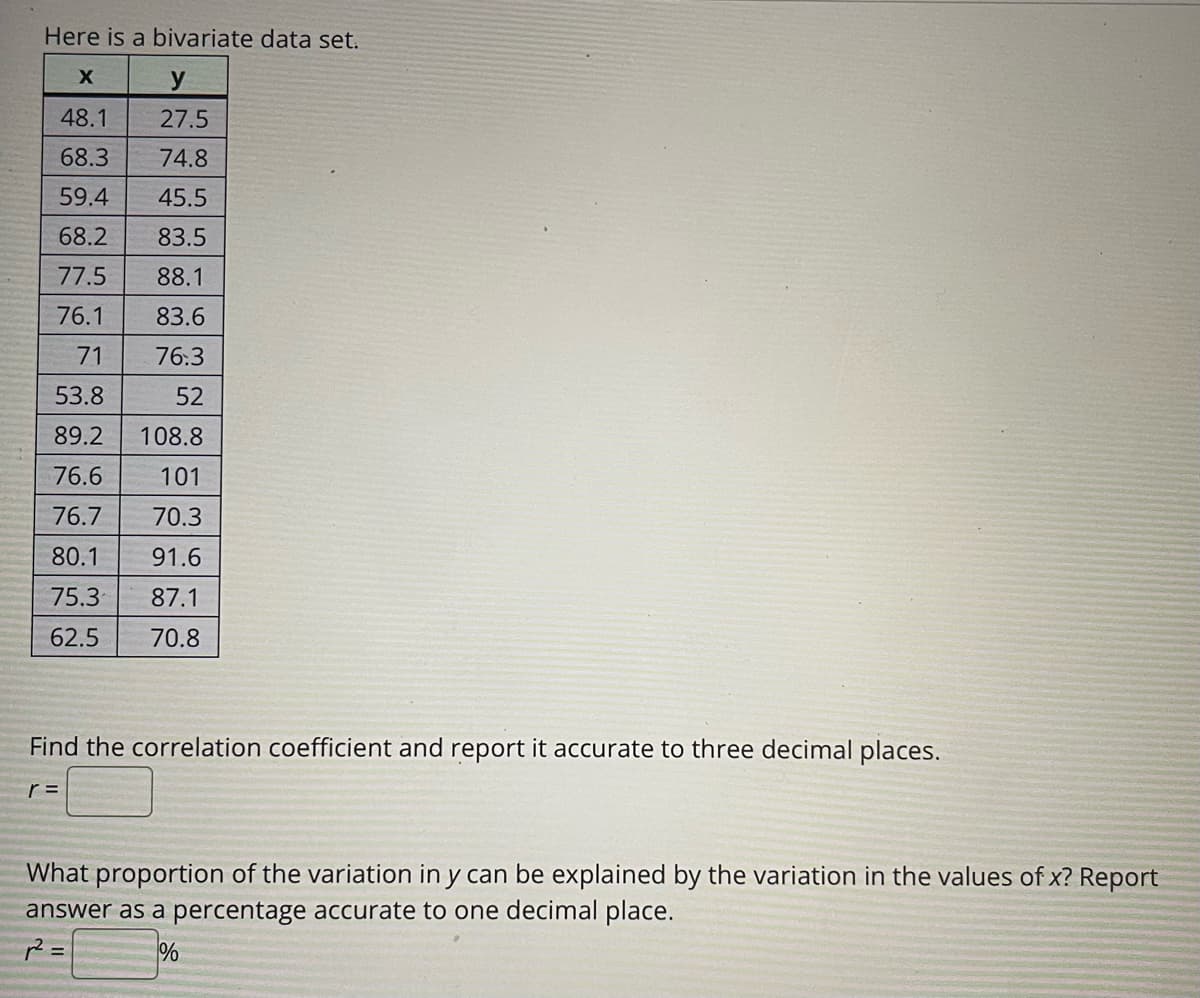
Transcribed Image Text:Here is a bivariate data set.
y
48.1
27.5
68.3
74.8
59.4
45.5
68.2
83.5
77.5
88.1
76.1
83.6
71
76.3
53.8
52
89.2
108.8
76.6
101
76.7
70.3
80.1
91.6
75.3
87.1
62.5
70.8
Find the correlation coefficient and report it accurate to three decimal places.
What proportion of the variation in y can be explained by the variation in the values of x? Report
answer as a percentage accurate to one decimal place.
Expert Solution
This question has been solved!
Explore an expertly crafted, step-by-step solution for a thorough understanding of key concepts.

Step by step
Solved in 3 steps with 4 images

Recommended textbooks for you
Glencoe Algebra 1, Student Edition, 9780079039897…
Algebra
ISBN:
9780079039897
Author:
Carter
Publisher:
McGraw Hill
Glencoe Algebra 1, Student Edition, 9780079039897…
Algebra
ISBN:
9780079039897
Author:
Carter
Publisher:
McGraw Hill