A sports analyst for the National Basketball Association wonders whether there is a relationship between a basketbal player's average points per game (PPG) and his average minutes per game (MPG). The accompanying tabie lists a portion of the data that he collected for ten players. (You may find it useful to reference the ttable.) Player PPG 30.1 27.1 MPG 36.1 35.3 2 10 21.3 35.3 picture Cick here for the Excel Data File a-1. Calculate the sample correlation coefficient between PPG and MPG. (Round final answer to 4 decimal places.) Sample correlation coefficient a-2. Interpret the sample correlation coefficient between PPG and MPG. O The correlation coefficient indicates a positive linear relationship. O The correlation coefficient indicates a negative linear relationship. O The correlation coefficient indicates no linear relationship. b. Specify the competing hypotheses in order to determine whether the population correlation between PPG and MPG is positive. O fHo: exy - 0: HA: exy
A sports analyst for the National Basketball Association wonders whether there is a relationship between a basketbal player's average points per game (PPG) and his average minutes per game (MPG). The accompanying tabie lists a portion of the data that he collected for ten players. (You may find it useful to reference the ttable.) Player PPG 30.1 27.1 MPG 36.1 35.3 2 10 21.3 35.3 picture Cick here for the Excel Data File a-1. Calculate the sample correlation coefficient between PPG and MPG. (Round final answer to 4 decimal places.) Sample correlation coefficient a-2. Interpret the sample correlation coefficient between PPG and MPG. O The correlation coefficient indicates a positive linear relationship. O The correlation coefficient indicates a negative linear relationship. O The correlation coefficient indicates no linear relationship. b. Specify the competing hypotheses in order to determine whether the population correlation between PPG and MPG is positive. O fHo: exy - 0: HA: exy

Algebra: Structure And Method, Book 1
(REV)00th Edition
ISBN:9780395977224
Author:Richard G. Brown, Mary P. Dolciani, Robert H. Sorgenfrey, William L. Cole
Publisher:Richard G. Brown, Mary P. Dolciani, Robert H. Sorgenfrey, William L. Cole
Chapter7: Applying Fractions
Section7.2: Proportions
Problem 50WE

Related questions
Question
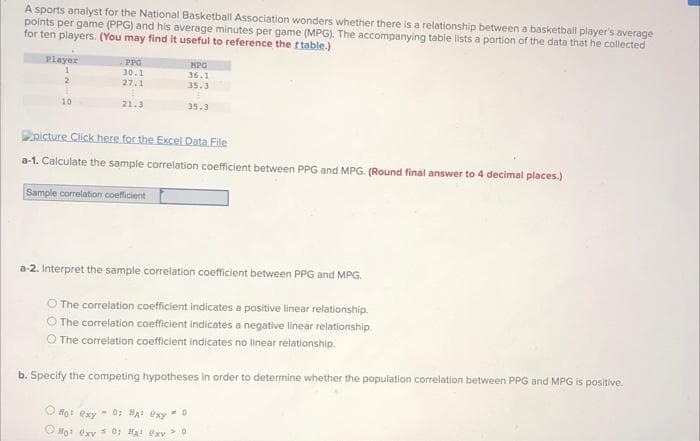
Transcribed Image Text:A sports analyst for the National Basketball Association wonders whether there is a relationship between a basketbail player's average
points per game (PPG) and his average minutes per game (MPG). The accompanying table lists a portion of the data that he collected
for ten players. (You may find it useful to reference the ttable.)
Player
PPG
30.1
27.1
MPG
36.1
35.3
10
21.3
35.3
picture Click here for the Excel Data File
a-1. Calculate the sample correlation coefficient between PPG and MPG. (Round final answer to 4 decimal places.)
Sample correlation coefficient
a-2. Interpret the sample correlation coefficient between PPG and MPG.
O The correlation coefficient indicates a positive linear relationship.
O The correlation coefficient indicates a negative linear relationship.
O The correlation coefficient indicates no linear relationship.
b. Specify the competing hypotheses in order to determine whether the population correlation between PPG and MPG is positive.
O Ho: exy
-O: HA exy0
O Ho: exv s0 HAt exv>0
Transcribed Image Text:Og: exy 0: at exy
O exy01 A exy
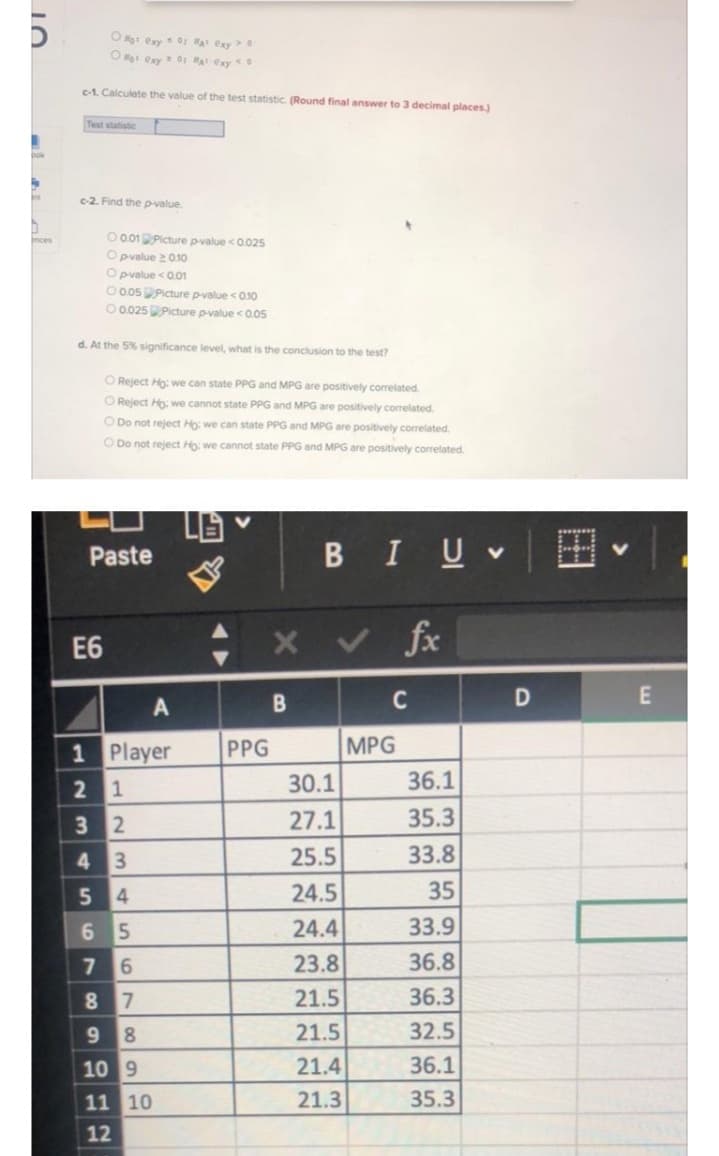
c-1. Calcuiate the value of the test statistic. (Round final answer to 3 decimal places)
Test atatistic
bok
Int
c-2. Find the p-value.
O 0.01 Picture p-value <0.025
O pvalue 201o
O pvalue <0.01
O 005Picture p-value <010
O 0025Picture pvalue <0.05
nces
d. At the 5% significance level, what is the conclusion to the test?
O Reject Ho: we can state PPG and MPG are positively correlated.
O Reject Ho: we cannot state PPG and MPG are positively correlated.
O Do not reject Ho: we can state PPG and MPG are positively correlated.
O Do not reject Ho: we cannot state PPG and MPG are positively correlated.
Paste
BIUV
E6
く fe
C
1 Player
PPG
MPG
2 1
30.1
36.1
3 2
27.1
35.3
3
25.5
33.8
4
24.5
35
24.4
33.9
23.8
36.8
8.
21.5
36.3
9.
8.
21.5
32.5
10 9
21.4
36.1
11 10
21.3
35.3
12
田
56
Expert Solution
This question has been solved!
Explore an expertly crafted, step-by-step solution for a thorough understanding of key concepts.

This is a popular solution!

Trending now
This is a popular solution!

Step by step
Solved in 2 steps with 1 images

Recommended textbooks for you
Algebra: Structure And Method, Book 1
Algebra
ISBN:
9780395977224
Author:
Richard G. Brown, Mary P. Dolciani, Robert H. Sorgenfrey, William L. Cole
Publisher:
McDougal Littell


Algebra: Structure And Method, Book 1
Algebra
ISBN:
9780395977224
Author:
Richard G. Brown, Mary P. Dolciani, Robert H. Sorgenfrey, William L. Cole
Publisher:
McDougal Littell

Glencoe Algebra 1, Student Edition, 9780079039897…
Algebra
ISBN:
9780079039897
Author:
Carter
Publisher:
McGraw Hill


Trigonometry (MindTap Course List)
Trigonometry
ISBN:
9781305652224
Author:
Charles P. McKeague, Mark D. Turner
Publisher:
Cengage Learning