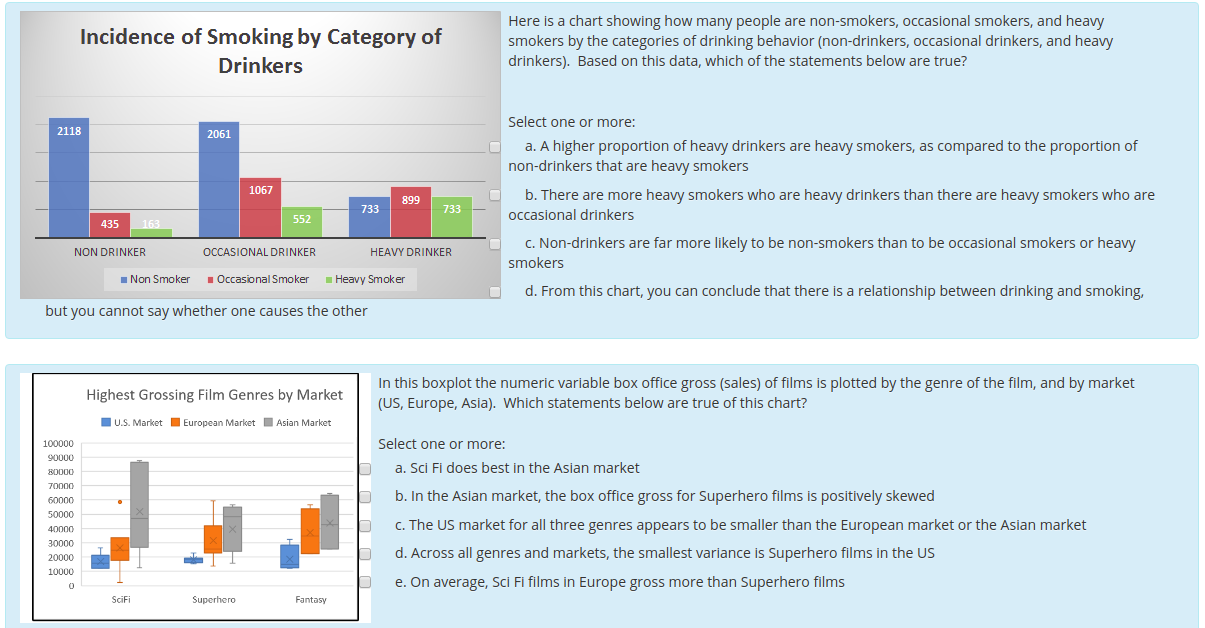
Here is a chart showing how many people are non-smokers, occasional smokers, and heavy smokers by the categories of drinking behavior (non-drinkers, occasional drinkers, and heavy drinkers). Based on this data, which of the statements below are true? Incidence of Smoking by Category of Drinkers Select one or more: 2118 2061 a. A higher proportion of heavy drinkers are heavy smokers, as compared to the proportion of non-drinkers that are heavy smokers 1067 b. There are more heavy smokers who are heavy drinkers than there are heavy smokers who are 899 733 733 occasional drinkers 552 435 163 163 c. Non-drinkers are far more likely to be non-smokers than to be occasional smokers or heavy NON DRINKER HEAVY DRINKER OCCASIONAL DRINKER smokers Occasional Smoker Non Smoker Heavy Smoker d. From this chart, you can conclude that there is a relationship between drinking and smoking, but you cannot say whether one causes the other In this boxplot the numeric variable box office gross (sales) of films is plotted by the genre of the film, and by market (US, Europe, Asia). Which statements below are true of this chart? Highest Grossing Film Genres by Market U.S. Market European Market Asian Market Select one or more: 100000 90000 a. Sci Fi does best in the Asian market B0000 70000 b. In the Asian market, the box office gross for Superhero films is positively skewed 60000 50000 c. The US market for all three genres appears to be smaller than the European market or the Asian market 40000 30000 d. Across all genres and markets, the smallest variance is Superhero films in the US 20000 10000 e. On average, Sci Fi films in Europe gross more than Superhero films SciFi Superhero Fantasy
Here is a chart showing how many people are non-smokers, occasional smokers, and heavy smokers by the categories of drinking behavior (non-drinkers, occasional drinkers, and heavy drinkers). Based on this data, which of the statements below are true? Incidence of Smoking by Category of Drinkers Select one or more: 2118 2061 a. A higher proportion of heavy drinkers are heavy smokers, as compared to the proportion of non-drinkers that are heavy smokers 1067 b. There are more heavy smokers who are heavy drinkers than there are heavy smokers who are 899 733 733 occasional drinkers 552 435 163 163 c. Non-drinkers are far more likely to be non-smokers than to be occasional smokers or heavy NON DRINKER HEAVY DRINKER OCCASIONAL DRINKER smokers Occasional Smoker Non Smoker Heavy Smoker d. From this chart, you can conclude that there is a relationship between drinking and smoking, but you cannot say whether one causes the other In this boxplot the numeric variable box office gross (sales) of films is plotted by the genre of the film, and by market (US, Europe, Asia). Which statements below are true of this chart? Highest Grossing Film Genres by Market U.S. Market European Market Asian Market Select one or more: 100000 90000 a. Sci Fi does best in the Asian market B0000 70000 b. In the Asian market, the box office gross for Superhero films is positively skewed 60000 50000 c. The US market for all three genres appears to be smaller than the European market or the Asian market 40000 30000 d. Across all genres and markets, the smallest variance is Superhero films in the US 20000 10000 e. On average, Sci Fi films in Europe gross more than Superhero films SciFi Superhero Fantasy

Glencoe Algebra 1, Student Edition, 9780079039897, 0079039898, 2018
18th Edition
ISBN:9780079039897
Author:Carter
Publisher:Carter
Chapter10: Statistics
Section10.6: Summarizing Categorical Data
Problem 10CYU

Related questions
Question
Transcribed Image Text:Here is a chart showing how many people are non-smokers, occasional smokers, and heavy
smokers by the categories of drinking behavior (non-drinkers, occasional drinkers, and heavy
drinkers). Based on this data, which of the statements below are true?
Incidence of Smoking by Category of
Drinkers
Select one or more:
2118
2061
a. A higher proportion of heavy drinkers are heavy smokers, as compared to the proportion of
non-drinkers that are heavy smokers
1067
b. There are more heavy smokers who are heavy drinkers than there are heavy smokers who are
899
733
733
occasional drinkers
552
435
163
163
c. Non-drinkers are far more likely to be non-smokers than to be occasional smokers or heavy
NON DRINKER
HEAVY DRINKER
OCCASIONAL DRINKER
smokers
Occasional Smoker
Non Smoker
Heavy Smoker
d. From this chart, you can conclude that there is a relationship between drinking and smoking,
but you cannot say whether one causes the other
In this boxplot the numeric variable box office gross (sales) of films is plotted by the genre of the film, and by market
(US, Europe, Asia). Which statements below are true of this chart?
Highest Grossing Film Genres by Market
U.S. Market European Market
Asian Market
Select one or more:
100000
90000
a. Sci Fi does best in the Asian market
B0000
70000
b. In the Asian market, the box office gross for Superhero films is positively skewed
60000
50000
c. The US market for all three genres appears to be smaller than the European market or the Asian market
40000
30000
d. Across all genres and markets, the smallest variance is Superhero films in the US
20000
10000
e. On average, Sci Fi films in Europe gross more than Superhero films
SciFi
Superhero
Fantasy
Expert Solution
This question has been solved!
Explore an expertly crafted, step-by-step solution for a thorough understanding of key concepts.

This is a popular solution!

Trending now
This is a popular solution!

Step by step
Solved in 2 steps

Recommended textbooks for you
Glencoe Algebra 1, Student Edition, 9780079039897…
Algebra
ISBN:
9780079039897
Author:
Carter
Publisher:
McGraw Hill
Glencoe Algebra 1, Student Edition, 9780079039897…
Algebra
ISBN:
9780079039897
Author:
Carter
Publisher:
McGraw Hill