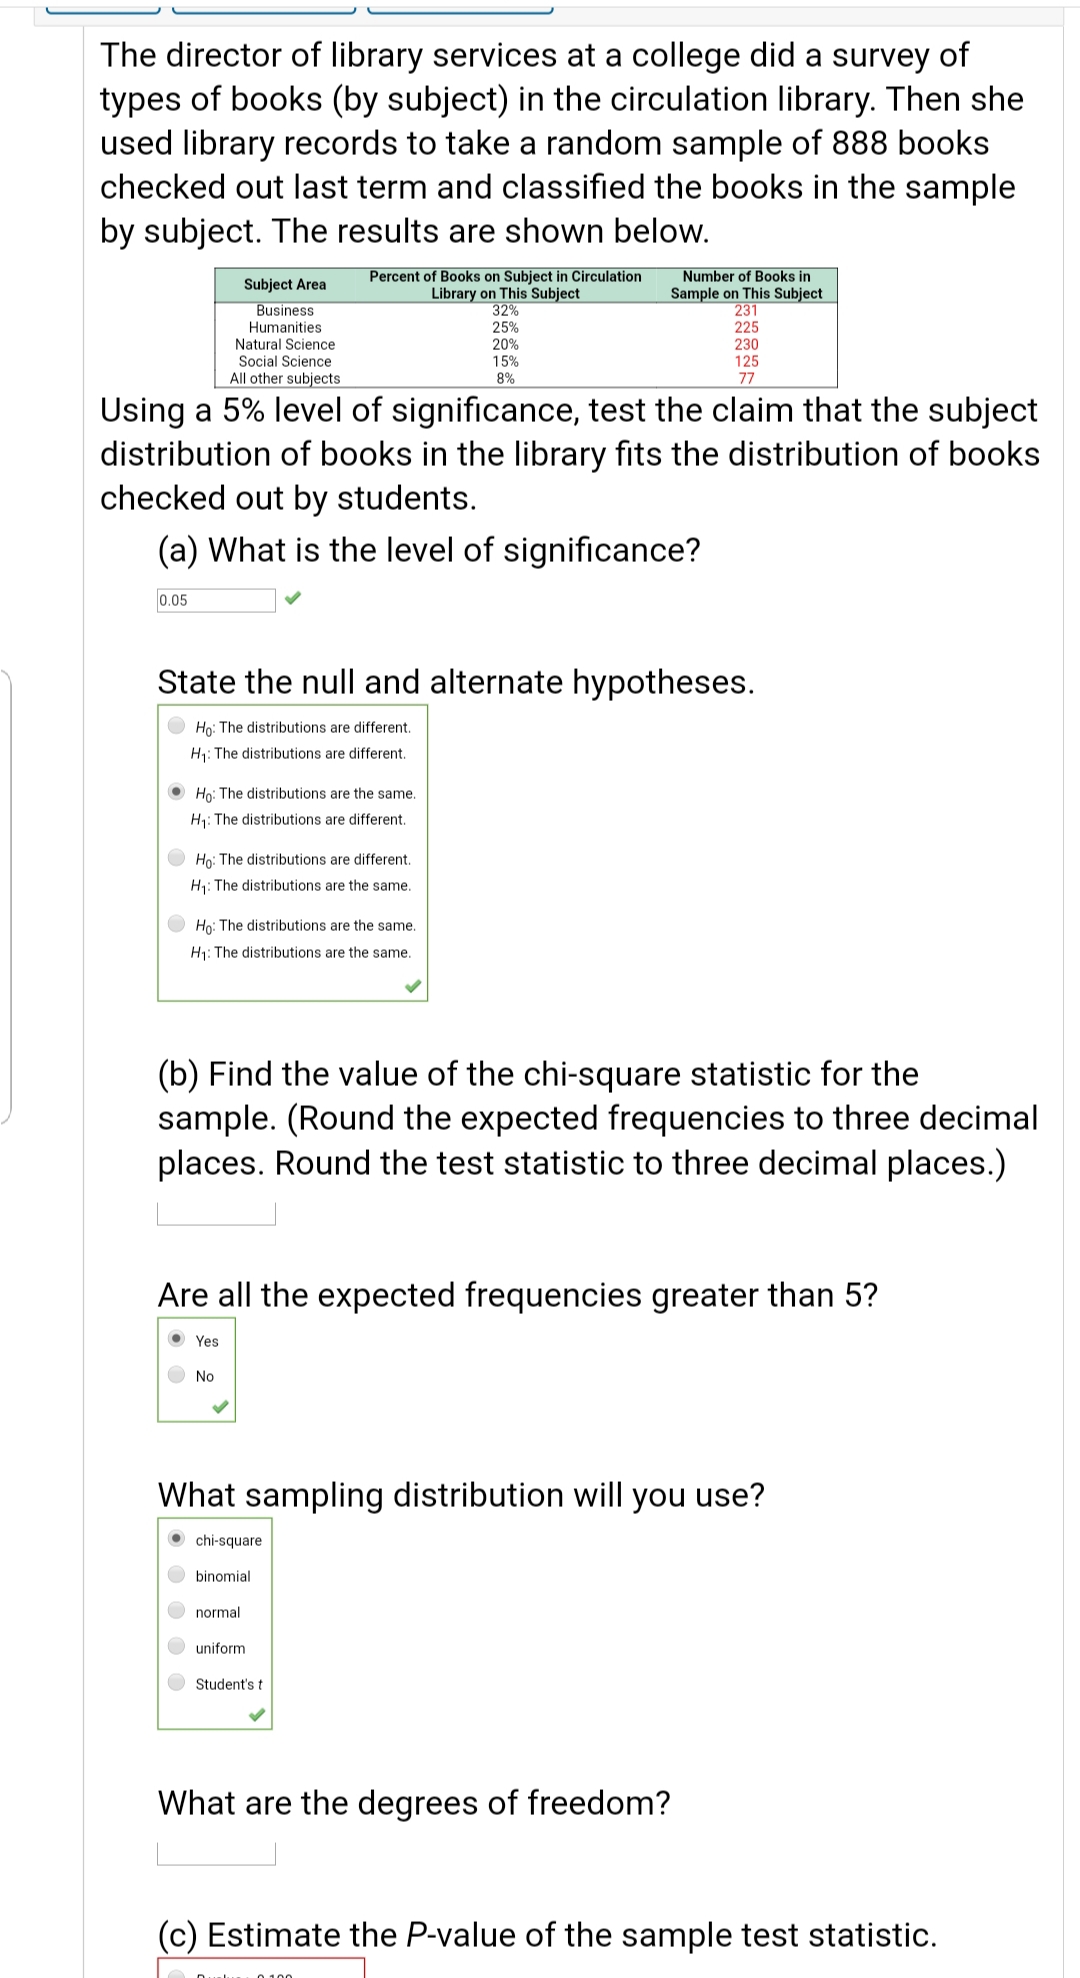
The director of library services at a college did a survey of types of books (by subject) in the circulation library. Then she used library records to take a random sample of 888 books checked out last term and classified the books in the sample by subject. The results are shown below. Percent of Books on Subject in Circulation Library on This Subject 32% 25% 20% 15% 8% Number of Books in Sample on This Subject 231 225 230 125 77 Subject Area Business Humanities Natural Science Social Science All other subjects Using a 5% level of significance, test the claim that the subject distribution of books in the library fits the distribution of books checked out by students. (a) What is the level of significance? 0.05 State the null and alternate hypotheses. Ho: The distributions are different. H1: The distributions are different. O Họ: The distributions are the same. H1: The distributions are different. Ho: The distributions are different. H1: The distributions are the same. Họ: The distributions are the same. H1: The distributions are the same. (b) Find the value of the chi-square statistic for the sample. (Round the expected frequencies to three decimal places. Round the test statistic to three decimal places.) Are all the expected frequencies greater than 5? O Yes No What sampling distribution will you use? chi-square binomial normal uniform Student's t What are the degrees of freedom? (c) Estimate the P-value of the sample test statistic.
The director of library services at a college did a survey of types of books (by subject) in the circulation library. Then she used library records to take a random sample of 888 books checked out last term and classified the books in the sample by subject. The results are shown below. Percent of Books on Subject in Circulation Library on This Subject 32% 25% 20% 15% 8% Number of Books in Sample on This Subject 231 225 230 125 77 Subject Area Business Humanities Natural Science Social Science All other subjects Using a 5% level of significance, test the claim that the subject distribution of books in the library fits the distribution of books checked out by students. (a) What is the level of significance? 0.05 State the null and alternate hypotheses. Ho: The distributions are different. H1: The distributions are different. O Họ: The distributions are the same. H1: The distributions are different. Ho: The distributions are different. H1: The distributions are the same. Họ: The distributions are the same. H1: The distributions are the same. (b) Find the value of the chi-square statistic for the sample. (Round the expected frequencies to three decimal places. Round the test statistic to three decimal places.) Are all the expected frequencies greater than 5? O Yes No What sampling distribution will you use? chi-square binomial normal uniform Student's t What are the degrees of freedom? (c) Estimate the P-value of the sample test statistic.

Glencoe Algebra 1, Student Edition, 9780079039897, 0079039898, 2018
18th Edition
ISBN:9780079039897
Author:Carter
Publisher:Carter
Chapter10: Statistics
Section10.6: Summarizing Categorical Data
Problem 13CYU

Related questions

Topic Video
Question
Transcribed Image Text:The director of library services at a college did a survey of
types of books (by subject) in the circulation library. Then she
used library records to take a random sample of 888 books
checked out last term and classified the books in the sample
by subject. The results are shown below.
Percent of Books on Subject in Circulation
Library on This Subject
32%
25%
20%
15%
8%
Number of Books in
Sample on This Subject
231
225
230
125
77
Subject Area
Business
Humanities
Natural Science
Social Science
All other subjects
Using a 5% level of significance, test the claim that the subject
distribution of books in the library fits the distribution of books
checked out by students.
(a) What is the level of significance?
0.05
State the null and alternate hypotheses.
Ho: The distributions are different.
H1: The distributions are different.
O Họ: The distributions are the same.
H1: The distributions are different.
Ho: The distributions are different.
H1: The distributions are the same.
Họ: The distributions are the same.
H1: The distributions are the same.
(b) Find the value of the chi-square statistic for the
sample. (Round the expected frequencies to three decimal
places. Round the test statistic to three decimal places.)
Are all the expected frequencies greater than 5?
O Yes
No
What sampling distribution will you use?
chi-square
binomial
normal
uniform
Student's t
What are the degrees of freedom?
(c) Estimate the P-value of the sample test statistic.
Expert Solution
This question has been solved!
Explore an expertly crafted, step-by-step solution for a thorough understanding of key concepts.

This is a popular solution!

Trending now
This is a popular solution!

Step by step
Solved in 4 steps with 4 images

Knowledge Booster


Learn more about
Need a deep-dive on the concept behind this application? Look no further. Learn more about this topic, statistics and related others by exploring similar questions and additional content below.Recommended textbooks for you
Glencoe Algebra 1, Student Edition, 9780079039897…
Algebra
ISBN:
9780079039897
Author:
Carter
Publisher:
McGraw Hill

Holt Mcdougal Larson Pre-algebra: Student Edition…
Algebra
ISBN:
9780547587776
Author:
HOLT MCDOUGAL
Publisher:
HOLT MCDOUGAL

College Algebra (MindTap Course List)
Algebra
ISBN:
9781305652231
Author:
R. David Gustafson, Jeff Hughes
Publisher:
Cengage Learning
Glencoe Algebra 1, Student Edition, 9780079039897…
Algebra
ISBN:
9780079039897
Author:
Carter
Publisher:
McGraw Hill
Holt Mcdougal Larson Pre-algebra: Student Edition…
Algebra
ISBN:
9780547587776
Author:
HOLT MCDOUGAL
Publisher:
HOLT MCDOUGAL
College Algebra (MindTap Course List)
Algebra
ISBN:
9781305652231
Author:
R. David Gustafson, Jeff Hughes
Publisher:
Cengage Learning