Here is some data for two variables: "Number of Office Hours Visits" and "Score in the Class." The covariance is 6.375. The mean number of visits is five with a standard deviation of 3.54. The mean score is 87.2 with a standard deviation of 11.3. What proportion of the variability (sum of squares) in "Score" is directly attributable to the variability in "Number of Visits"? (In other words, what is the proportion of explained squared error?) Visits Score 3 68 1 95 89 10 88 7 96
Here is some data for two variables: "Number of Office Hours Visits" and "Score in the Class." The covariance is 6.375. The mean number of visits is five with a standard deviation of 3.54. The mean score is 87.2 with a standard deviation of 11.3. What proportion of the variability (sum of squares) in "Score" is directly attributable to the variability in "Number of Visits"? (In other words, what is the proportion of explained squared error?) Visits Score 3 68 1 95 89 10 88 7 96

MATLAB: An Introduction with Applications
6th Edition
ISBN:9781119256830
Author:Amos Gilat
Publisher:Amos Gilat
Chapter1: Starting With Matlab
Section: Chapter Questions
Problem 1P

Related questions
Question
Here is some data for two variables: "Number of Office Hours Visits" and "Score in the
Class." The
deviation of 3.54. The mean score is 87.2 with a standard deviation of 11.3. What
proportion of the variability (sum of squares) in "Score" is directly attributable to the
variability in "Number of Visits"? (In other words, what is the proportion of explained
squared error?)
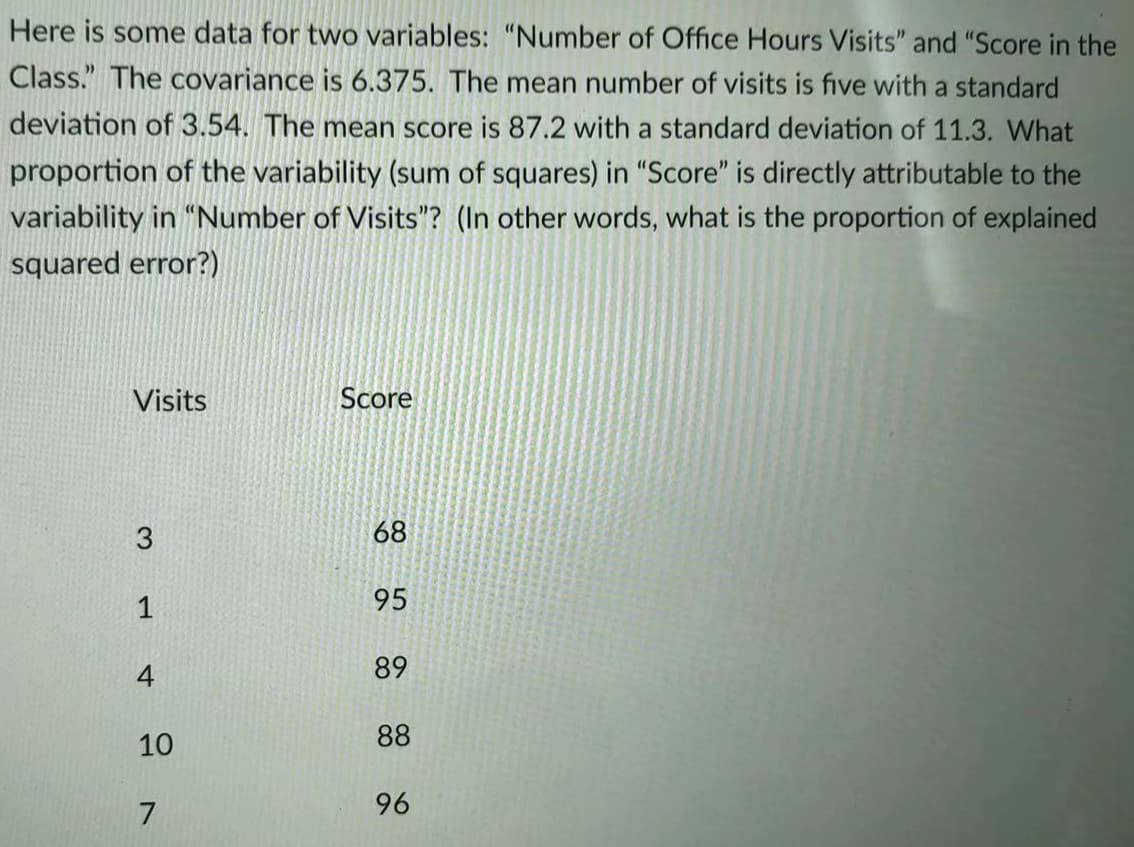
Transcribed Image Text:Here is some data for two variables: "Number of Office Hours Visits" and "Score in the
Class." The covariance is 6.375. The mean number of visits is five with a standard
deviation of 3.54. The mean score is 87.2 with a standard deviation of 11.3. What
proportion of the variability (sum of squares) in "Score" is directly attributable to the
variability in "Number of Visits"? (In other words, what is the proportion of explained
squared error?)
Visits
Score
68
1
95
4
89
10
88
96
3.
Expert Solution
This question has been solved!
Explore an expertly crafted, step-by-step solution for a thorough understanding of key concepts.

This is a popular solution!

Trending now
This is a popular solution!

Step by step
Solved in 2 steps

Recommended textbooks for you
MATLAB: An Introduction with Applications
Statistics
ISBN:
9781119256830
Author:
Amos Gilat
Publisher:
John Wiley & Sons Inc

Probability and Statistics for Engineering and th…
Statistics
ISBN:
9781305251809
Author:
Jay L. Devore
Publisher:
Cengage Learning

Statistics for The Behavioral Sciences (MindTap C…
Statistics
ISBN:
9781305504912
Author:
Frederick J Gravetter, Larry B. Wallnau
Publisher:
Cengage Learning
MATLAB: An Introduction with Applications
Statistics
ISBN:
9781119256830
Author:
Amos Gilat
Publisher:
John Wiley & Sons Inc
Probability and Statistics for Engineering and th…
Statistics
ISBN:
9781305251809
Author:
Jay L. Devore
Publisher:
Cengage Learning
Statistics for The Behavioral Sciences (MindTap C…
Statistics
ISBN:
9781305504912
Author:
Frederick J Gravetter, Larry B. Wallnau
Publisher:
Cengage Learning

Elementary Statistics: Picturing the World (7th E…
Statistics
ISBN:
9780134683416
Author:
Ron Larson, Betsy Farber
Publisher:
PEARSON

The Basic Practice of Statistics
Statistics
ISBN:
9781319042578
Author:
David S. Moore, William I. Notz, Michael A. Fligner
Publisher:
W. H. Freeman

Introduction to the Practice of Statistics
Statistics
ISBN:
9781319013387
Author:
David S. Moore, George P. McCabe, Bruce A. Craig
Publisher:
W. H. Freeman