Here is the complete Excel outpu SUMMARY OUTPUT

College Algebra
7th Edition
ISBN:9781305115545
Author:James Stewart, Lothar Redlin, Saleem Watson
Publisher:James Stewart, Lothar Redlin, Saleem Watson
Chapter1: Equations And Graphs
Section: Chapter Questions
Problem 10T: Olympic Pole Vault The graph in Figure 7 indicates that in recent years the winning Olympic men’s...

Related questions
Topic Video
Question
Thank you.
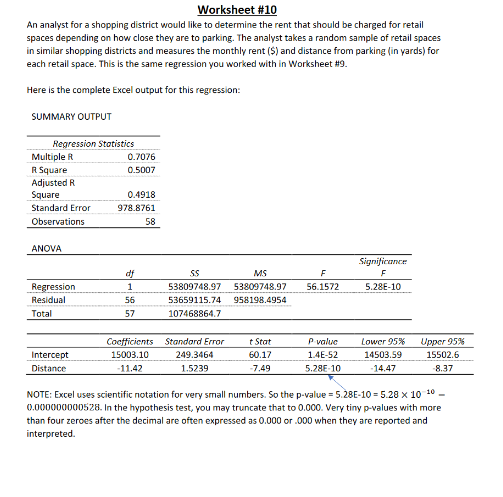
Transcribed Image Text:Worksheet #10
An analyst for a shopping district would like to determine the rent that should be charged for retail
spaces depending on how close they are to parking. The analyst takes a random sample of retail spaces
in similar shopping districts and measures the monthly rent ($) and distance from parking (in yards) for
each retail space. This is the same regression you worked with in Worksheet #9.
Here is the complete Excel output for this regression:
SUMMARY OUTPUT
Regression Stotistics
Multiple R
R Square
0.7076
0.5007
Adjusted R
Square
Standard Error
0.4918
978.8761
Observations
58
ANOVA
Significaner
df
SS
MS
Regression
1
53809748.97
53809748.97
56.1572
5.28E-10
Residual
56
53659115.74
958198.4954
Total
57
107468864.7
Coefficients
t Stat
P value
Upper 95%
Standard Error
Lower 95%
Intercept
15003.10
249.3464
60.17
1.4E-52
14503.59
15502.6
Distance
-11.42
1.5239
-7,49
5.28E-10
-14.47
8.37
NOTE: Excel uses scientific notation for very small numbers. So the p-value = 5.28E-10 = 5.28 x 10 10 -
0.000000000528. In the hypothesis test, you may truncate that to 0.000. Very tiny p-values with more
than four zeroes after the decimal are often expressed as 0.000 or .000 when they are reported and
interpreted.
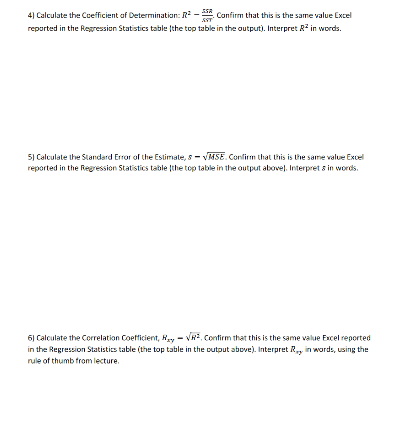
Transcribed Image Text:4) Calculate the Coefficient af Determination: R - Confirm that this is the same value Excel
reported in the Regression Statistics table the top table in the output). Interpret R in words.
5) Calculate the Standard Error of the Estimate, s- VMSE. Conlirm that this is the same value Excel
reported in the Regression Statistics table the top table in the output above). Interpret s in words.
6) Calculate the Correlation Coefficient, Ry - VR2, Confirm that this is the same value Excel reported
in the Regression Statistics table (the top table in the output above). Interpret R, in words, using the
rule of thumb from lecture.
Expert Solution
This question has been solved!
Explore an expertly crafted, step-by-step solution for a thorough understanding of key concepts.

Step by step
Solved in 2 steps

Knowledge Booster


Learn more about
Need a deep-dive on the concept behind this application? Look no further. Learn more about this topic, statistics and related others by exploring similar questions and additional content below.Recommended textbooks for you
College Algebra
Algebra
ISBN:
9781305115545
Author:
James Stewart, Lothar Redlin, Saleem Watson
Publisher:
Cengage Learning

Linear Algebra: A Modern Introduction
Algebra
ISBN:
9781285463247
Author:
David Poole
Publisher:
Cengage Learning

Glencoe Algebra 1, Student Edition, 9780079039897…
Algebra
ISBN:
9780079039897
Author:
Carter
Publisher:
McGraw Hill
College Algebra
Algebra
ISBN:
9781305115545
Author:
James Stewart, Lothar Redlin, Saleem Watson
Publisher:
Cengage Learning
Linear Algebra: A Modern Introduction
Algebra
ISBN:
9781285463247
Author:
David Poole
Publisher:
Cengage Learning
Glencoe Algebra 1, Student Edition, 9780079039897…
Algebra
ISBN:
9780079039897
Author:
Carter
Publisher:
McGraw Hill