here to view the table of critic here to view page 1 of the sta s here to view page 2 of the sta
here to view the table of critic here to view page 1 of the sta s here to view page 2 of the sta

Glencoe Algebra 1, Student Edition, 9780079039897, 0079039898, 2018
18th Edition
ISBN:9780079039897
Author:Carter
Publisher:Carter
Chapter10: Statistics
Section10.4: Distributions Of Data
Problem 19PFA

Related questions
Question
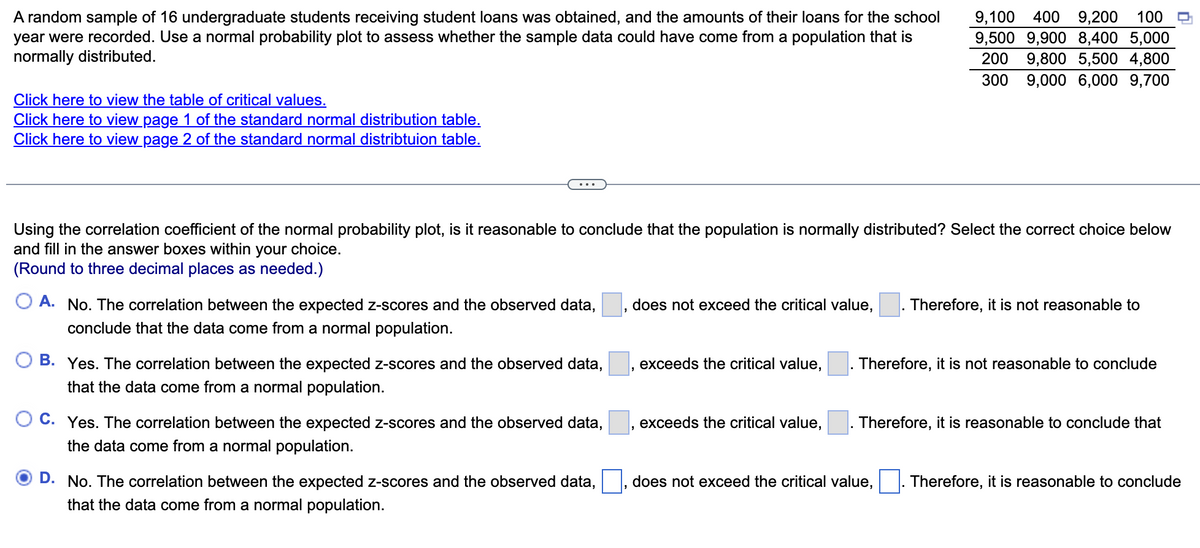
Transcribed Image Text:A random sample of 16 undergraduate students receiving student loans was obtained, and the amounts of their loans for the school
year were recorded. Use a normal probability plot to assess whether the sample data could have come from a population that is
normally distributed.
9,100 400
9,200
100
9,500 9,900 8,400 5,000
200
9,800 5,500 4,800
300
9,000 6,000 9,700
Click here to view the table of critical values.
Click here to view page 1 of the standard normal distribution table.
Click here to view page 2 of the standard normal distribtuion table.
Using the correlation coefficient of the normal probability plot, is it reasonable to conclude that the population is normally distributed? Select the correct choice below
and fill in the answer boxes within your choice.
(Round to three decimal places as needed.)
O A. No. The correlation between the expected z-scores and the observed data,
does not exceed the critical value,
Therefore, it is not reasonable to
conclude that the data come from a normal population.
B. Yes. The correlation between the expected z-scores and the observed data,
exceeds the critical value,
Therefore, it is not reasonable to conclude
that the data come from a normal population.
O C. Yes. The correlation between the expected z-scores and the observed data,
exceeds the critical value,
Therefore, it is reasonable to conclude that
the data come from a normal population.
D. No. The correlation between the expected z-scores and the observed data,
does not exceed the critical value,
Therefore, it is reasonable to conclude
that the data come from a normal population.
Expert Solution
This question has been solved!
Explore an expertly crafted, step-by-step solution for a thorough understanding of key concepts.

This is a popular solution!

Trending now
This is a popular solution!

Step by step
Solved in 4 steps with 2 images

Recommended textbooks for you
Glencoe Algebra 1, Student Edition, 9780079039897…
Algebra
ISBN:
9780079039897
Author:
Carter
Publisher:
McGraw Hill
Glencoe Algebra 1, Student Edition, 9780079039897…
Algebra
ISBN:
9780079039897
Author:
Carter
Publisher:
McGraw Hill