Seattle Grace Medical Center. As part of a long-term study of individuals 65 years of age or older, doctors at the Seattle Grace Medical Center in Washington state investigated the relationship between state of residence and depression. A sample of 60 individuals, all in reasonably good health, was selected; 20 individuals were residents of Texas, 20 were residents of Washington state, and 20 were residents of South Carolina. Each of the individuals sampled was given a standardized test to measure depression. The data collected follow; higher test scores indicate higher levels of depression. These data are contained in the attached data file SeattleGrace1. A second part of the study considered the relationship between state of residence and depression for individuals 65 years of age or older who had a chronic health condition such as diabetes and/or high blood pressure. A sample of 60 individuals with such conditions was identified. Again, 20 were residents of Texas, 20 were residents of Washington state, and 20 were residents of South Carolina. The levels of depression recorded for this study follow. These data are contained in the attached data file named SeattleGrace2. Prepare a report that addresses the following: a. Use analysis of variance on both data sets. State the hypotheses being tested in each case. b. What are your conclusions based on the results from part A? c. Use inferences about individual treatment means where appropriate. d. What are your conclusions based on the results from part C?


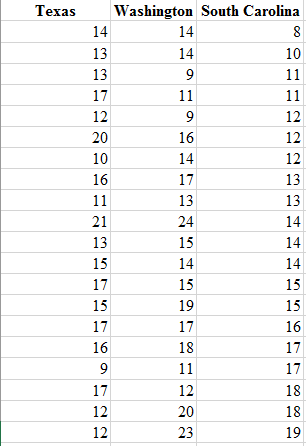
Seattle Grace Medical Center. As part of a long-term study of individuals 65 years of age or older, doctors at the Seattle Grace Medical Center in Washington state investigated the relationship between state of residence and depression. A sample of 60 individuals, all in reasonably good health, was selected; 20 individuals were residents of Texas, 20 were residents of Washington state, and 20 were residents of South Carolina. Each of the individuals sampled was given a standardized test to measure depression. The data collected follow; higher test scores indicate higher levels of depression. These data are contained in the attached data file SeattleGrace1.
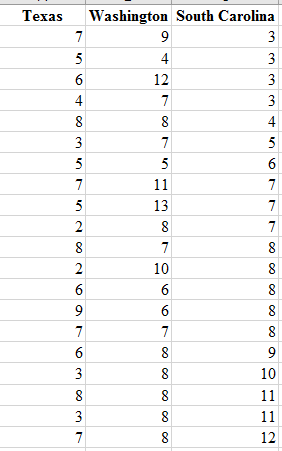
A second part of the study considered the relationship between state of residence and depression for individuals 65 years of age or older who had a chronic health condition such as diabetes and/or high blood pressure. A sample of 60 individuals with such conditions was identified. Again, 20 were residents of Texas, 20 were residents of Washington state, and 20 were residents of South Carolina. The levels of depression recorded for this study follow. These data are contained in the attached data file named SeattleGrace2.
Prepare a report that addresses the following:
a. Use analysis of variance on both data sets. State the hypotheses being tested in each case.
b. What are your conclusions based on the results from part A?
c. Use inferences about individual treatment means where appropriate.
d. What are your conclusions based on the results from part C?


Trending now
This is a popular solution!

Step by step
Solved in 5 steps with 6 images
