High (x) 36 28 94 83 69 62 66 56 41 30 29 58 46 43 70 88 80 55 88 Low (y) 2011902280 0 22 22 74 1 55 45 45 71 41 33 21 18 45 36 33 45 73 76 38 71 High (x) 38 61 61 65 87 33 87 38 52 71 34 55 60 38 82 27 47 51 81 Low (y) 28 41 46 51 79 23 68 34 41 48 24 42 52 25 78 15 34 39 64
High (x) 36 28 94 83 69 62 66 56 41 30 29 58 46 43 70 88 80 55 88 Low (y) 2011902280 0 22 22 74 1 55 45 45 71 41 33 21 18 45 36 33 45 73 76 38 71 High (x) 38 61 61 65 87 33 87 38 52 71 34 55 60 38 82 27 47 51 81 Low (y) 28 41 46 51 79 23 68 34 41 48 24 42 52 25 78 15 34 39 64

Chapter1: Introducing The Economic Way Of Thinking
Section1.A: Applying Graphs To Economics
Problem 2SQP

Related questions
Question
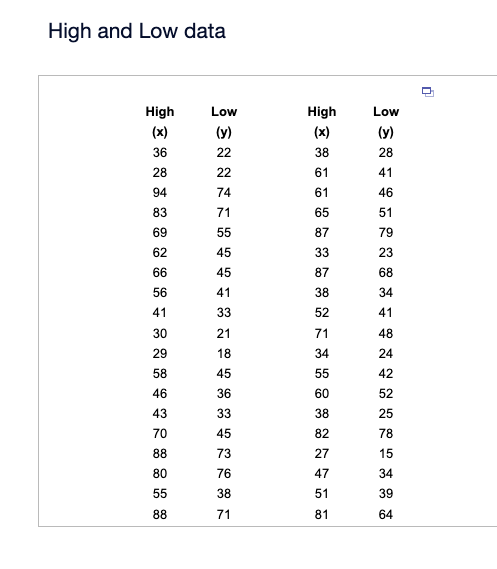
Transcribed Image Text:High and Low data
High
(x)
36
28
94
83
69
62
66
56
41
30
29
58
46
43
70
88
80
55
88
Low
(y)
22
22
74
71
55
45
45
41
33
21
18
45
36
33
45
73
76
38
71
High
(x)
38
61
61
65
87
33
87
38
52
71
34
55
60
38
82
27
47
51
81
Low
(y)
28
41
46
51
79
23
68
34
41
48
24
42
52
25
78
15
34
39
64
n
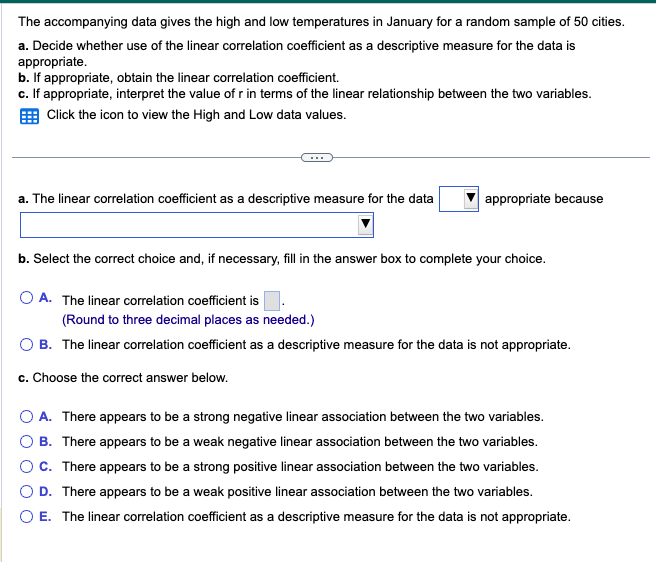
Transcribed Image Text:The accompanying data gives the high and low temperatures in January for a random sample of 50 cities.
a. Decide whether use of the linear correlation coefficient as a descriptive measure for the data is
appropriate.
b. If appropriate, obtain the linear correlation coefficient.
c. If appropriate, interpret the value of r in terms of the linear relationship between the two variables.
Click the icon to view the High and Low data values.
a. The linear correlation coefficient as a descriptive measure for the data
appropriate because
b. Select the correct choice and, if necessary, fill in the answer box to complete your choice.
OA. The linear correlation coefficient is
(Round to three decimal places as needed.)
O B. The linear correlation coefficient as a descriptive measure for the data is not appropriate.
c. Choose the correct answer below.
O A. There appears to be a strong negative linear association between the two variables.
OB. There appears to be a weak negative linear association between the two variables.
O C. There appears to be a strong positive linear association between the two variables.
O D. There appears to be a weak positive linear association between the two variables.
O E. The linear correlation coefficient as a descriptive measure for the data is not appropriate.
Expert Solution
This question has been solved!
Explore an expertly crafted, step-by-step solution for a thorough understanding of key concepts.

Step by step
Solved in 2 steps

Knowledge Booster


Learn more about
Need a deep-dive on the concept behind this application? Look no further. Learn more about this topic, economics and related others by exploring similar questions and additional content below.Recommended textbooks for you


Managerial Economics: Applications, Strategies an…
Economics
ISBN:
9781305506381
Author:
James R. McGuigan, R. Charles Moyer, Frederick H.deB. Harris
Publisher:
Cengage Learning