Home | iCampus Bb Week 8 - MAT300457VA016-121... A ALEKS - Shasia Gibbs O DESCRIPTIVE STATISTICS Shasia v Histograms for grouped data The heights (in inches) for a sample of 23 male adults are 62, 82, 79, 76, 73, 70, 67, 64, 61, 80, 79, 75, 72, 69, 66, 63, 60, 72, 72, 72, 68, 68, 65 Send data to calculator Draw the histogram for these data using an initial class boundary of 59.5, an ending class boundary of 84.5, and 5 classes of equal width. Note that you can add or remove classes from the figure. Label each class with its endpoints. Explanation Check 20ZIMICGeWAEeucoAERights Reserved Terms of Use I Privacy Accesscibility
Home | iCampus Bb Week 8 - MAT300457VA016-121... A ALEKS - Shasia Gibbs O DESCRIPTIVE STATISTICS Shasia v Histograms for grouped data The heights (in inches) for a sample of 23 male adults are 62, 82, 79, 76, 73, 70, 67, 64, 61, 80, 79, 75, 72, 69, 66, 63, 60, 72, 72, 72, 68, 68, 65 Send data to calculator Draw the histogram for these data using an initial class boundary of 59.5, an ending class boundary of 84.5, and 5 classes of equal width. Note that you can add or remove classes from the figure. Label each class with its endpoints. Explanation Check 20ZIMICGeWAEeucoAERights Reserved Terms of Use I Privacy Accesscibility

Glencoe Algebra 1, Student Edition, 9780079039897, 0079039898, 2018
18th Edition
ISBN:9780079039897
Author:Carter
Publisher:Carter
Chapter10: Statistics
Section: Chapter Questions
Problem 25SGR

Related questions

Question
Transcribed Image Text:Home | iCampus
Bb Week 8 - MAT300457VA016-121...
A ALEKS - Shasia Gibbs
O DESCRIPTIVE STATISTICS
Shasia v
Histograms for grouped data
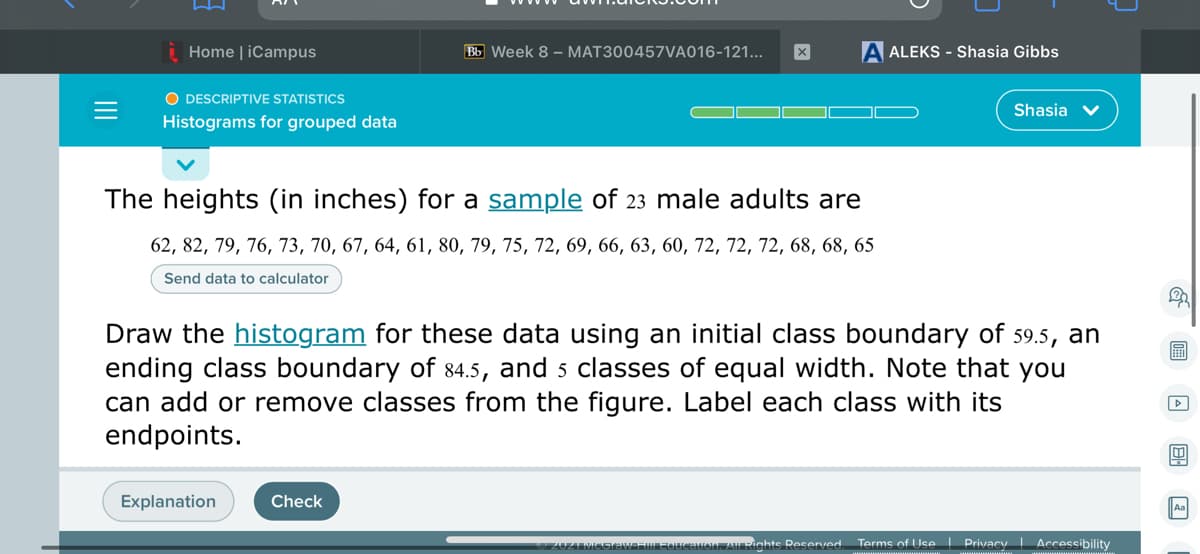
The heights (in inches) for a sample of 23 male adults are
62, 82, 79, 76, 73, 70, 67, 64, 61, 80, 79, 75, 72, 69, 66, 63, 60, 72, 72, 72, 68, 68, 65
Send data to calculator
Draw the histogram for these data using an initial class boundary of 59.5, an
ending class boundary of 84.5, and 5 classes of equal width. Note that you
can add or remove classes from the figure. Label each class with its
endpoints.
圖
Explanation
Check
Aa
2UZIMICEIAWAT FOUeO AU RIghts Reserved. Terms of Use Privacy Accessibility
Transcribed Image Text:O DESCRIPTIVE STATISTICS
Shasia v
Histograms for grouped data
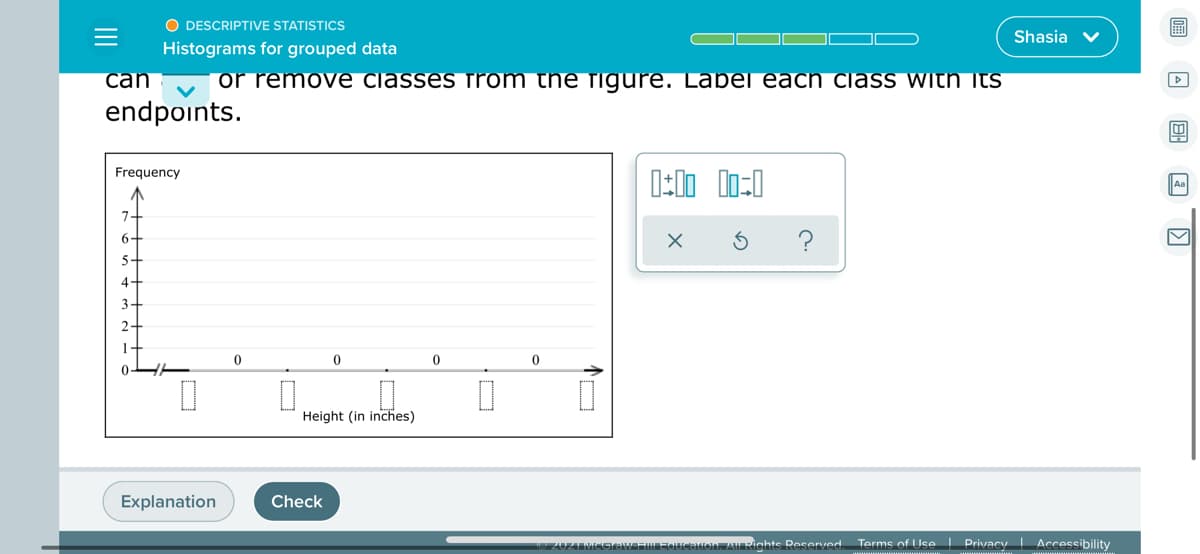
can
or remove classes from the figure. Label each class with its
endpoints.
Frequency
Aa
?
6-
5-
4-
3
2.
1.
Height (in inches)
Explanation
Check
U 20ZI MCGIAWAFI Foucalieinh Au Rights Reserved. Terms of Use Privacy Accessibility
Expert Solution
This question has been solved!
Explore an expertly crafted, step-by-step solution for a thorough understanding of key concepts.

This is a popular solution!

Trending now
This is a popular solution!

Step by step
Solved in 2 steps with 2 images

Knowledge Booster


Learn more about
Need a deep-dive on the concept behind this application? Look no further. Learn more about this topic, statistics and related others by exploring similar questions and additional content below.Recommended textbooks for you
Glencoe Algebra 1, Student Edition, 9780079039897…
Algebra
ISBN:
9780079039897
Author:
Carter
Publisher:
McGraw Hill
Glencoe Algebra 1, Student Edition, 9780079039897…
Algebra
ISBN:
9780079039897
Author:
Carter
Publisher:
McGraw Hill