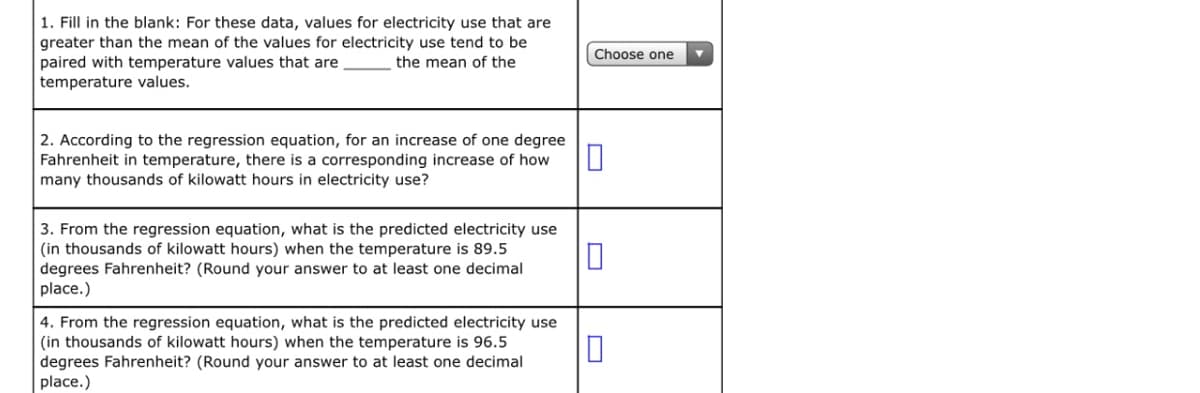
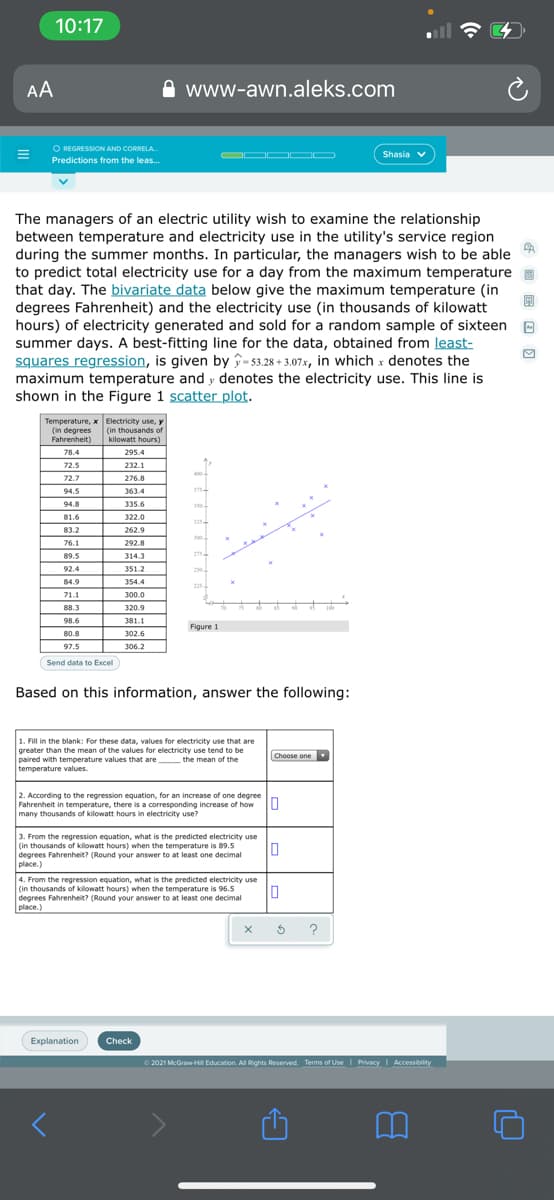
The managers of an electric utility wish to examine the relationship between temperature and electricity use in the utility's service region during the summer months. In particular, the managers wish to be able to predict total electricity use for a day from the maximum temperature that day. The bivariate data below give the maximum temperature (in degrees Fahrenheit) and the electricity use (in thousands of kilowatt hours) of electricity generated and sold for a random sample of sixteen summer days. A best-fitting line for the data, obtained from least- squares regression, is given by -s53.28 + 3.07x, in which x denotes the maximum temperature and y denotes the electricity use. This line is shown in the Figure 1 scatter plot. Temperature, x Electricity use, y (in thousands of kilowatt hours) (in degrees Fahrenheit) 78.4 295.4 72.5 232.1 400- 72.7 276.8 94.5 363.4 94.8 335.6 350 81.6 322.0 325 83.2 262.9 300 76.1 292.8 89.5 314.3 275 92.4 351.2 250 84.9 354.4 225 71.1 300.0 88.3 320.9 98.6 381.1 Figure 1 80.8 302.6 97.5 306.2 Send data to Excel Based on this information, answer the following: 1. Fill in the blank: For these data, values for electricity use that are greater than the mean of the values for electricity use tend to be paired with temperature values that are the mean of the temperature values. Choose one 2. According to the regression equation, for an increase of one degree Fahrenheit in temperature, there is a corresponding increase of how U many thousands of kilowatt hours in electricity use? 3. From the regression equation, what is the predicted electricity use (in thousands of kilowatt hours) when the temperature is 89.5 degrees Fahrenheit? (Round your answer to at least one decimal place.) 4. From the regression equation, what is the predicted electricity use (in thousands of kilowatt hours) when the temperature is 96.5 degrees Fahrenheit? (Round your answer to at least one decimal place.)
The managers of an electric utility wish to examine the relationship between temperature and electricity use in the utility's service region during the summer months. In particular, the managers wish to be able to predict total electricity use for a day from the maximum temperature that day. The bivariate data below give the maximum temperature (in degrees Fahrenheit) and the electricity use (in thousands of kilowatt hours) of electricity generated and sold for a random sample of sixteen summer days. A best-fitting line for the data, obtained from least- squares regression, is given by -s53.28 + 3.07x, in which x denotes the maximum temperature and y denotes the electricity use. This line is shown in the Figure 1 scatter plot. Temperature, x Electricity use, y (in thousands of kilowatt hours) (in degrees Fahrenheit) 78.4 295.4 72.5 232.1 400- 72.7 276.8 94.5 363.4 94.8 335.6 350 81.6 322.0 325 83.2 262.9 300 76.1 292.8 89.5 314.3 275 92.4 351.2 250 84.9 354.4 225 71.1 300.0 88.3 320.9 98.6 381.1 Figure 1 80.8 302.6 97.5 306.2 Send data to Excel Based on this information, answer the following: 1. Fill in the blank: For these data, values for electricity use that are greater than the mean of the values for electricity use tend to be paired with temperature values that are the mean of the temperature values. Choose one 2. According to the regression equation, for an increase of one degree Fahrenheit in temperature, there is a corresponding increase of how U many thousands of kilowatt hours in electricity use? 3. From the regression equation, what is the predicted electricity use (in thousands of kilowatt hours) when the temperature is 89.5 degrees Fahrenheit? (Round your answer to at least one decimal place.) 4. From the regression equation, what is the predicted electricity use (in thousands of kilowatt hours) when the temperature is 96.5 degrees Fahrenheit? (Round your answer to at least one decimal place.)

Glencoe Algebra 1, Student Edition, 9780079039897, 0079039898, 2018
18th Edition
ISBN:9780079039897
Author:Carter
Publisher:Carter
Chapter10: Statistics
Section10.3: Measures Of Spread
Problem 1GP

Related questions

Topic Video
Question
1. Greater than or less than?
Transcribed Image Text:1. Fill in the blank: For these data, values for electricity use that are
greater than the mean of the values for electricity use tend to be
paired with temperature values that are
temperature values.
Choose one
the mean of the
2. According to the regression equation, for an increase of one degree
Fahrenheit in temperature, there is a corresponding increase of how
many thousands of kilowatt hours in electricity use?
3. From the regression equation, what is the predicted electricity use
(in thousands of kilowatt hours) when the temperature is 89.5
degrees Fahrenheit? (Round your answer to at least one decimal
place.)
4. From the regression equation, what is the predicted electricity use
(in thousands of kilowatt hours) when the temperature is 96.5
degrees Fahrenheit? (Round your answer to at least one decimal
place.)
Transcribed Image Text:10:17
AA
www-awn.aleks.com
O REGRESSION AND CORRELA.
OO OO
Shasia v
Predictions from the leas..
The managers of an electric utility wish to examine the relationship
between temperature and electricity use in the utility's service region
during the summer months. In particular, the managers wish to be able
to predict total electricity use for a day from the maximum temperature
that day. The bivariate data below give the maximum temperature (in
degrees Fahrenheit) and the electricity use (in thousands of kilowatt
hours) of electricity generated and sold for a random sample of sixteen
summer days. A best-fitting line for the data, obtained from least-
squares regression, is given by -53.28 + 3,07x, in which x denotes the
maximum temperature and y denotes the electricity use. This line is
shown in the Figure 1 scatter plot.
Temperature, x Electricity use, y
(in degrees (in thousands of
Fahrenheit)
kilowatt hours)
78.4
295.4
72.5
232.1
400-
72.7
276.8
94.5
363.4
375-
94.8
335.6
350
81.6
322.0
325
83.2
262.9
300
76.1
292.8
89.5
314.3
275
92.4
351.2
250
84.9
354.4
225
71.1
300.0
88.3
320.9
98.6
381.1
Figure 1
80.8
302.6
97.5
306.2
Send data to Excel
Based on this information, answer the following:
1. Fill in the blank: For these data, values for electricity use that are
greater than the mean of the values for electricity use tend to be
paired with temperature values that are the mean of the
temperature values.
Choose one
2. According to the regression equation, for an increase of one degree
Fahrenheit in temperature, there is a corresponding increase of how U
many thousands of kilowatt hours in electricity use?
3. From the regression equation, what is the predicted electricity use
(in thousands of kilowatt hours) when the temperature is 89.5
degrees Fahrenheit? (Round your answer to at least one decimal
place.)
4. From the regression equation, what is the predicted electricity use
(in thousands of kilowatt hours) when the temperature is 96.5
degrees Fahrenheit? (Round your answer to at least one decimal
place.)
?
Explanation
Check
O 2021 McGraw-HI Education. All Rights Reserved. Terms of Use I Privacy I Accessibility
Expert Solution
This question has been solved!
Explore an expertly crafted, step-by-step solution for a thorough understanding of key concepts.

This is a popular solution!

Trending now
This is a popular solution!

Step by step
Solved in 2 steps

Knowledge Booster


Learn more about
Need a deep-dive on the concept behind this application? Look no further. Learn more about this topic, statistics and related others by exploring similar questions and additional content below.Recommended textbooks for you
Glencoe Algebra 1, Student Edition, 9780079039897…
Algebra
ISBN:
9780079039897
Author:
Carter
Publisher:
McGraw Hill
Glencoe Algebra 1, Student Edition, 9780079039897…
Algebra
ISBN:
9780079039897
Author:
Carter
Publisher:
McGraw Hill