Homework (Ch 21) Consider a hypothetical economy in which households spend $0.50 of each additional dollar they earn and save the remaining $0.50. The following graph shows the economy's initial aggregate demand curve (AD₁). . Suppose the government increases its purchases by $3 billion. Use the green line (triangle symbol) on the following graph to show the aggregate demand curve (AD₂) after the multiplier effect takes place. Hint: Be sure the new aggregate demand curve (AD2) is parallel to AD₁. You can see the slope of AD₁ by selecting it on the following graph. 116
Homework (Ch 21) Consider a hypothetical economy in which households spend $0.50 of each additional dollar they earn and save the remaining $0.50. The following graph shows the economy's initial aggregate demand curve (AD₁). . Suppose the government increases its purchases by $3 billion. Use the green line (triangle symbol) on the following graph to show the aggregate demand curve (AD₂) after the multiplier effect takes place. Hint: Be sure the new aggregate demand curve (AD2) is parallel to AD₁. You can see the slope of AD₁ by selecting it on the following graph. 116

Chapter11: Managing Aggregate Demand: Fiscal Policy
Section: Chapter Questions
Problem 1TY

Related questions
Question
Transcribed Image Text:Homework (Ch 21)
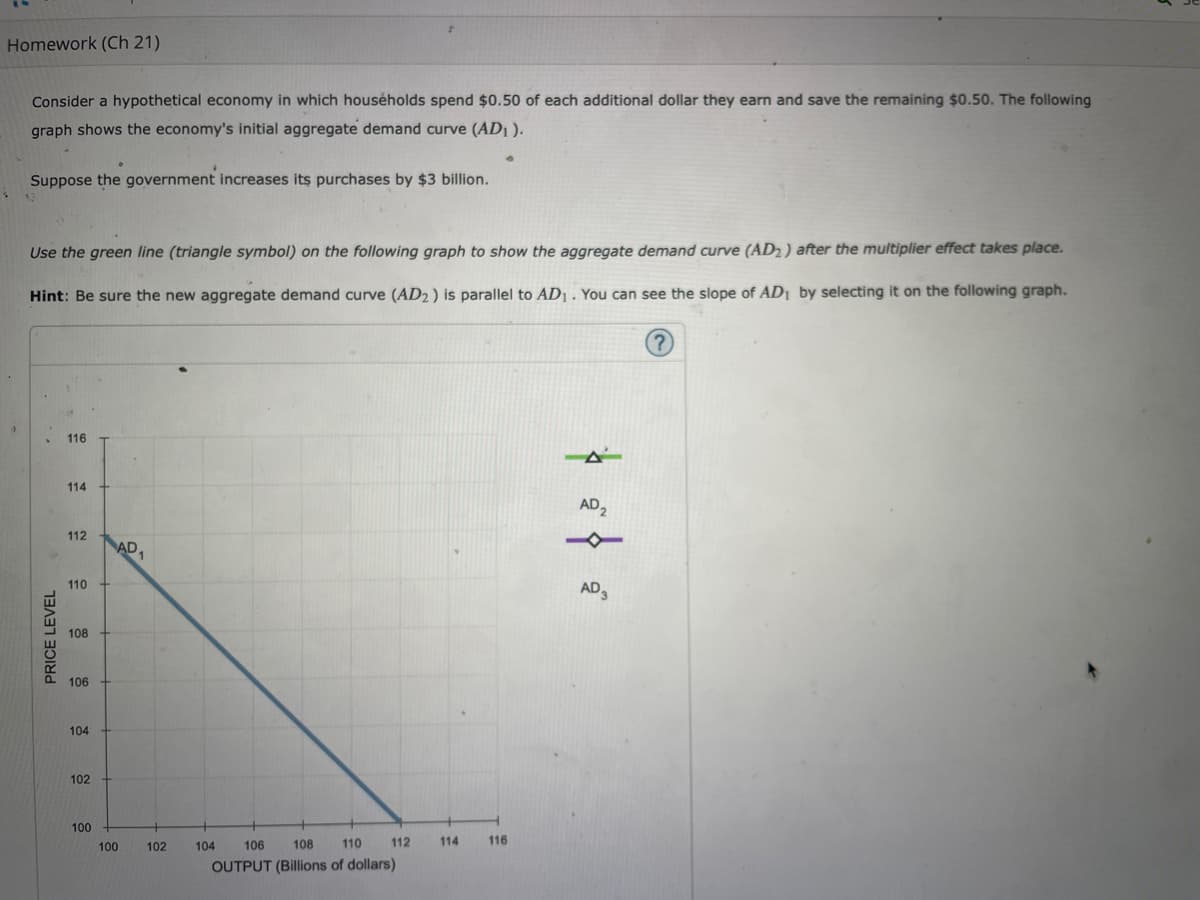
Consider a hypothetical economy in which households spend $0.50 of each additional dollar they earn and save the remaining $0.50. The following
graph shows the economy's initial aggregate demand curve (AD₁).
Suppose the government increases its purchases by $3 billion.
Use the green line (triangle symbol) on the following graph to show the aggregate demand curve (AD2) after the multiplier effect takes place.
Hint: Be sure the new aggregate demand curve (AD2) is parallel to AD₁. You can see the slope of AD₁ by selecting it on the following graph.
PRICE LEVEL
116
114
112
110
108
106
104
102
100
100
AD1
102
112
104 106
108
110
OUTPUT (Billions of dollars)
114 116
AD₂
AD 3
Transcribed Image Text:Study Tools
ons
cess Tips
ess Tips
ck
CENGAGE | MINDTAP
Homework (Ch 21)
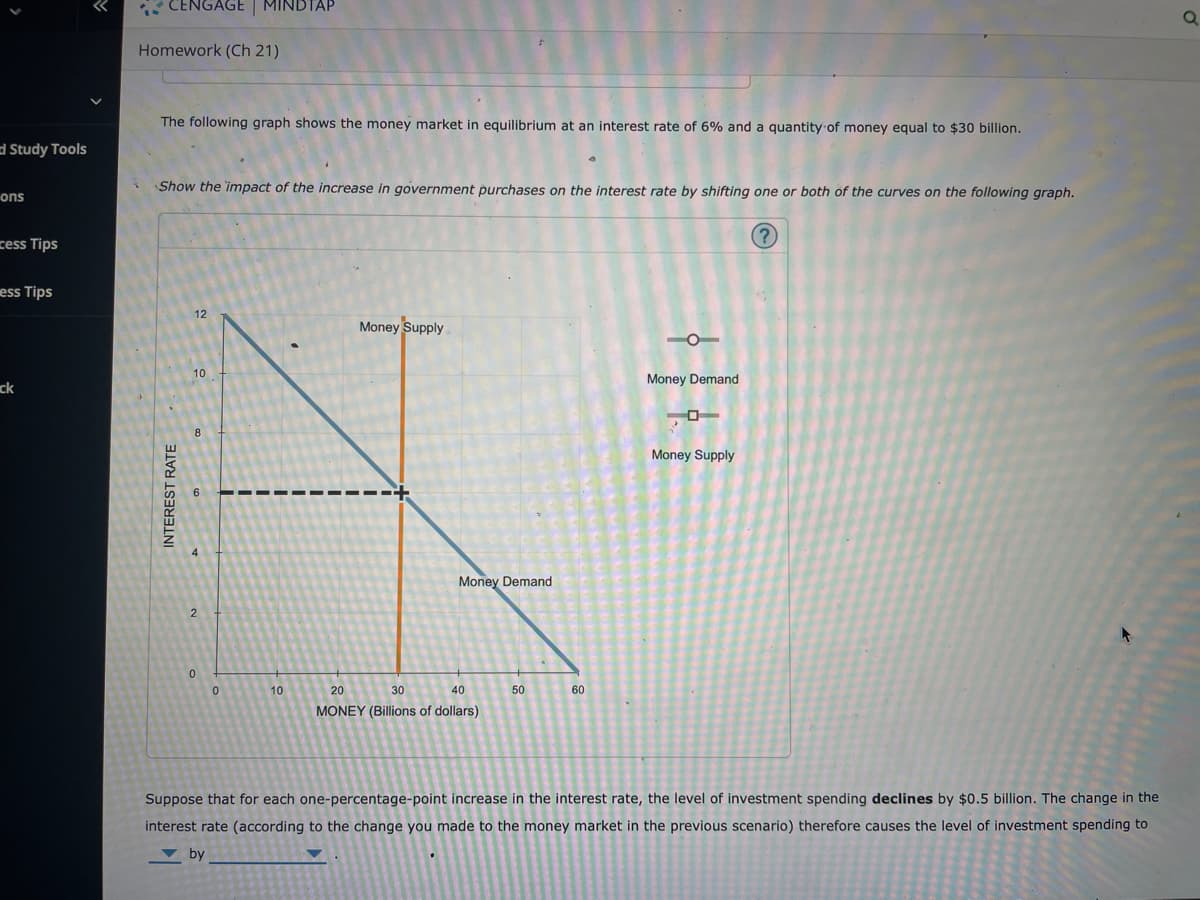
The following graph shows the money market in equilibrium at an interest rate of 6% and a quantity of money equal to $30 billion.
Show the impact of the increase in government purchases on the interest rate by shifting one or both of the curves on the following graph.
?
INTEREST RATE
12
10
8
2
0
0
10
Money Supply
Money Demand
20
30
40
MONEY (Billions of dollars)
50
60
Money Demand
O
Money Supply
Suppose that for each one-percentage-point increase in the interest rate, the level of investment spending declines by $0.5 billion. The change in the
interest rate (according to the change you made to the money market in the previous scenario) therefore causes the level of investment spending to
by
О
Expert Solution
This question has been solved!
Explore an expertly crafted, step-by-step solution for a thorough understanding of key concepts.

This is a popular solution!

Trending now
This is a popular solution!

Step by step
Solved in 2 steps with 1 images

Knowledge Booster


Learn more about
Need a deep-dive on the concept behind this application? Look no further. Learn more about this topic, economics and related others by exploring similar questions and additional content below.Recommended textbooks for you


Macroeconomics: Principles and Policy (MindTap Co…
Economics
ISBN:
9781305280601
Author:
William J. Baumol, Alan S. Blinder
Publisher:
Cengage Learning