Consider a hypothetical economy in which households spend $0.50 of each additional dollar they earn and save the remaining $0.50. The following graph shows the economy's initial aggregate demand curve (AD1AD1). Suppose the government increases its purchases by $3 billion. Use the green line (triangle symbol) on the following graph to show the aggregate demand curve (AD2AD2) after the multiplier effect takes place. Hint: Be sure the new aggregate demand curve (AD2AD2) is parallel to AD1AD1. You can see the slope of AD1AD1 by selecting it on the following graph. Suppose that for each one-percentage-point increase in the interest rate, the level of investment spending declines by $0.5 billion. The change in the interest rate (according to the change you made to the money market in the previous scenario) therefore causes the level of investment spending to Fall/Rise by 2 ,1, or 0.5 Billion. After the multiplier effect is accounted for, the change in investment spending will cause the quantity of output demanded to Increase/decrease by 0.8, 1 Billion, 2 Billion at each price level. The impact of an increase in government purchases on the interest rate and the level of investment spending is known as the Multiplier, liquidity preference, crowding out, or automatic stabilizer effect. Use the purple line (diamond symbol) on the graph at the beginning of this problem to show the aggregate demand curve (AD3AD3) after accounting for the impact of the increase in government purchases on the interest rate and the level of investment spending. Hint: Be sure your final aggregate demand curve (AD3AD3) is parallel to AD1AD1 and AD2AD2. You can see the slopes of AD1AD1 and AD2AD2 by selecting them on the graph.
Consider a hypothetical economy in which households spend $0.50 of each additional dollar they earn and save the remaining $0.50. The following graph shows the economy's initial aggregate demand curve (AD1AD1). Suppose the government increases its purchases by $3 billion. Use the green line (triangle symbol) on the following graph to show the aggregate demand curve (AD2AD2) after the multiplier effect takes place. Hint: Be sure the new aggregate demand curve (AD2AD2) is parallel to AD1AD1. You can see the slope of AD1AD1 by selecting it on the following graph. Suppose that for each one-percentage-point increase in the interest rate, the level of investment spending declines by $0.5 billion. The change in the interest rate (according to the change you made to the money market in the previous scenario) therefore causes the level of investment spending to Fall/Rise by 2 ,1, or 0.5 Billion. After the multiplier effect is accounted for, the change in investment spending will cause the quantity of output demanded to Increase/decrease by 0.8, 1 Billion, 2 Billion at each price level. The impact of an increase in government purchases on the interest rate and the level of investment spending is known as the Multiplier, liquidity preference, crowding out, or automatic stabilizer effect. Use the purple line (diamond symbol) on the graph at the beginning of this problem to show the aggregate demand curve (AD3AD3) after accounting for the impact of the increase in government purchases on the interest rate and the level of investment spending. Hint: Be sure your final aggregate demand curve (AD3AD3) is parallel to AD1AD1 and AD2AD2. You can see the slopes of AD1AD1 and AD2AD2 by selecting them on the graph.

Chapter9: Aggregate Demand
Section: Chapter Questions
Problem 6.13P

Related questions
Question
100%
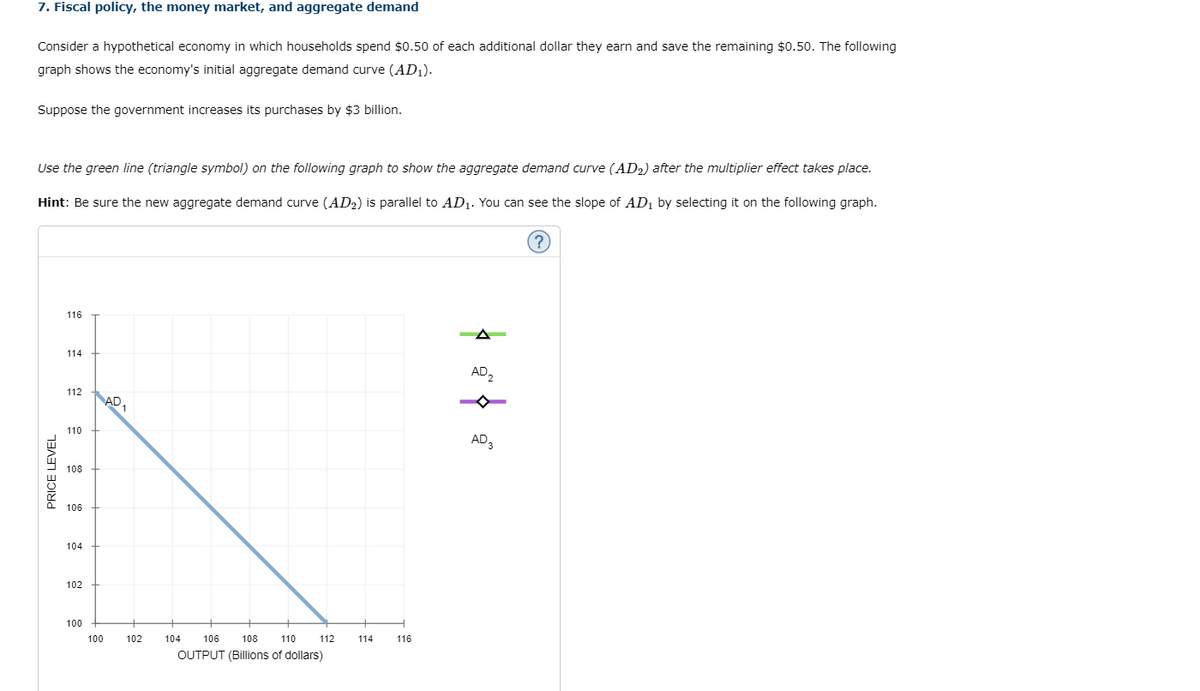
Consider a hypothetical economy in which households spend $0.50 of each additional dollar they earn and save the remaining $0.50. The following graph shows the economy's initial aggregate demand curve (AD1AD1).
Suppose the government increases its purchases by $3 billion.
Use the green line (triangle symbol) on the following graph to show the aggregate demand curve (AD2AD2) after the multiplier effect takes place.
Hint: Be sure the new aggregate demand curve (AD2AD2) is parallel to AD1AD1. You can see the slope of AD1AD1 by selecting it on the following graph.
Suppose that for each one-percentage-point increase in the interest rate, the level of investment spending declines by $0.5 billion. The change in the interest rate (according to the change you made to the money market in the previous scenario) therefore causes the level of investment spending to Fall/Rise by 2 ,1, or 0.5 Billion.
After the multiplier effect is accounted for, the change in investment spending will cause the quantity of output demanded to Increase/decrease by 0.8, 1 Billion, 2 Billion at each price level. The impact of an increase in government purchases on the interest rate and the level of investment spending is known as the Multiplier, liquidity preference, crowding out, or automatic stabilizer effect.
Use the purple line (diamond symbol) on the graph at the beginning of this problem to show the aggregate demand curve (AD3AD3) after accounting for the impact of the increase in government purchases on the interest rate and the level of investment spending.
Hint: Be sure your final aggregate demand curve (AD3AD3) is parallel to AD1AD1 and AD2AD2. You can see the slopes of AD1AD1 and AD2AD2 by selecting them on the graph.
Transcribed Image Text:7. Fiscal policy, the money market, and aggregate demand
Consider a hypothetical economy in which households spend $0.50 of each additional dollar they earn and save the remaining $0.50. The following
graph shows the economy's initial aggregate demand curve (AD1).
Suppose the government increases its purchases by $3 billion.
Use the green line (triangle symbol) on the following graph to show the aggregate demand curve (AD2) after the multiplier effect takes place.
Hint: Be sure the new aggregate demand curve (AD2) is parallel to AD1. You can see the slope of AD1 by selecting it on the following graph.
?)
116
A
114
AD,
112
AD,
110
AD,
108
106
104
102
100
100
102
104
106
108
110
112
114
116
OUTPUT (Billions of dollars)
PRICE LEVEL
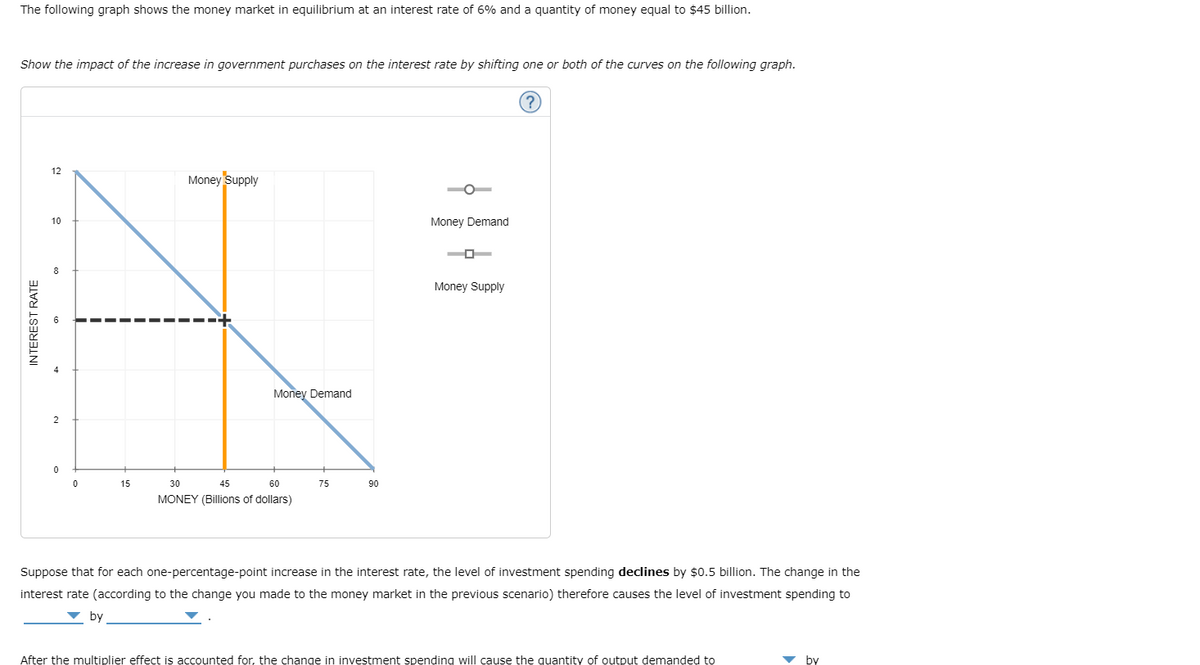
Transcribed Image Text:The following graph shows the money market in equilibrium at an interest rate of 6% and a quantity of money equal to $45 billion.
Show the impact of the increase in government purchases on the interest rate by shifting one or both of the curves on the following graph.
12
Money Supply
10
Money Demand
Money Supply
Money Demand
2
15
30
45
60
75
90
MONEY (Billions of dollars)
Suppose that for each one-percentage-point increase in the interest rate, the level of investment spending declines by $0.5 billion. The change in the
interest rate (according to the change you made to the money market in the previous scenario) therefore causes the level of investment spending to
v by
After the multiplier effect is accounted for, the change in investment spending will cause the quantity of output demanded to
v by
INTEREST RATE
Expert Solution
This question has been solved!
Explore an expertly crafted, step-by-step solution for a thorough understanding of key concepts.

This is a popular solution!

Trending now
This is a popular solution!

Step by step
Solved in 5 steps with 2 images

Follow-up Questions
Read through expert solutions to related follow-up questions below.
Follow-up Question
How do you know how the interest rates changes? Why do you know iit went up 2%?? how do you figure that out ????
Solution
Follow-up Question
How do you determine how much the interest rates rise ? Why is it 2% ??
Solution
Knowledge Booster


Learn more about
Need a deep-dive on the concept behind this application? Look no further. Learn more about this topic, economics and related others by exploring similar questions and additional content below.Recommended textbooks for you

Survey of Economics (MindTap Course List)
Economics
ISBN:
9781305260948
Author:
Irvin B. Tucker
Publisher:
Cengage Learning

Brief Principles of Macroeconomics (MindTap Cours…
Economics
ISBN:
9781337091985
Author:
N. Gregory Mankiw
Publisher:
Cengage Learning
Survey of Economics (MindTap Course List)
Economics
ISBN:
9781305260948
Author:
Irvin B. Tucker
Publisher:
Cengage Learning
Brief Principles of Macroeconomics (MindTap Cours…
Economics
ISBN:
9781337091985
Author:
N. Gregory Mankiw
Publisher:
Cengage Learning

Essentials of Economics (MindTap Course List)
Economics
ISBN:
9781337091992
Author:
N. Gregory Mankiw
Publisher:
Cengage Learning


Principles of Macroeconomics (MindTap Course List)
Economics
ISBN:
9781285165912
Author:
N. Gregory Mankiw
Publisher:
Cengage Learning