Hospital admissions: The following frequency distribution presents the five most frequent reasons for hospital admissions in U.S. community hospitals in a recent year. Frequency (in thousands) Reason Congestive heart fallure 98 Coronary atherosclerosis 134 Heart attack 65 Infant birth 385 Pneumonia 118
Hospital admissions: The following frequency distribution presents the five most frequent reasons for hospital admissions in U.S. community hospitals in a recent year. Frequency (in thousands) Reason Congestive heart fallure 98 Coronary atherosclerosis 134 Heart attack 65 Infant birth 385 Pneumonia 118

Glencoe Algebra 1, Student Edition, 9780079039897, 0079039898, 2018
18th Edition
ISBN:9780079039897
Author:Carter
Publisher:Carter
Chapter10: Statistics
Section: Chapter Questions
Problem 13PT

Related questions
Question
With the given information, construct a frequency bar graph.
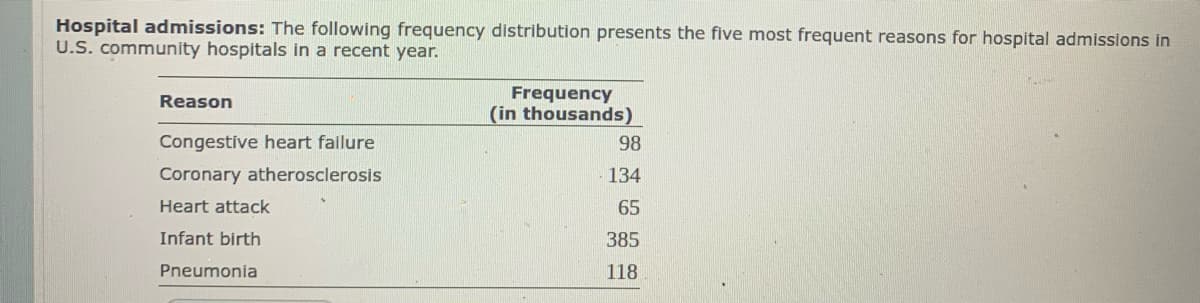
Transcribed Image Text:Hospital admissions: The following frequency distribution presents the five most frequent reasons for hospital admissions in
U.S. community hospitals in a recent year.
Frequency
(in thousands)
Reason
Congestive heart failure
98
Coronary atherosclerosis
134
Heart attack
65
Infant birth
385
Pneumonia
118
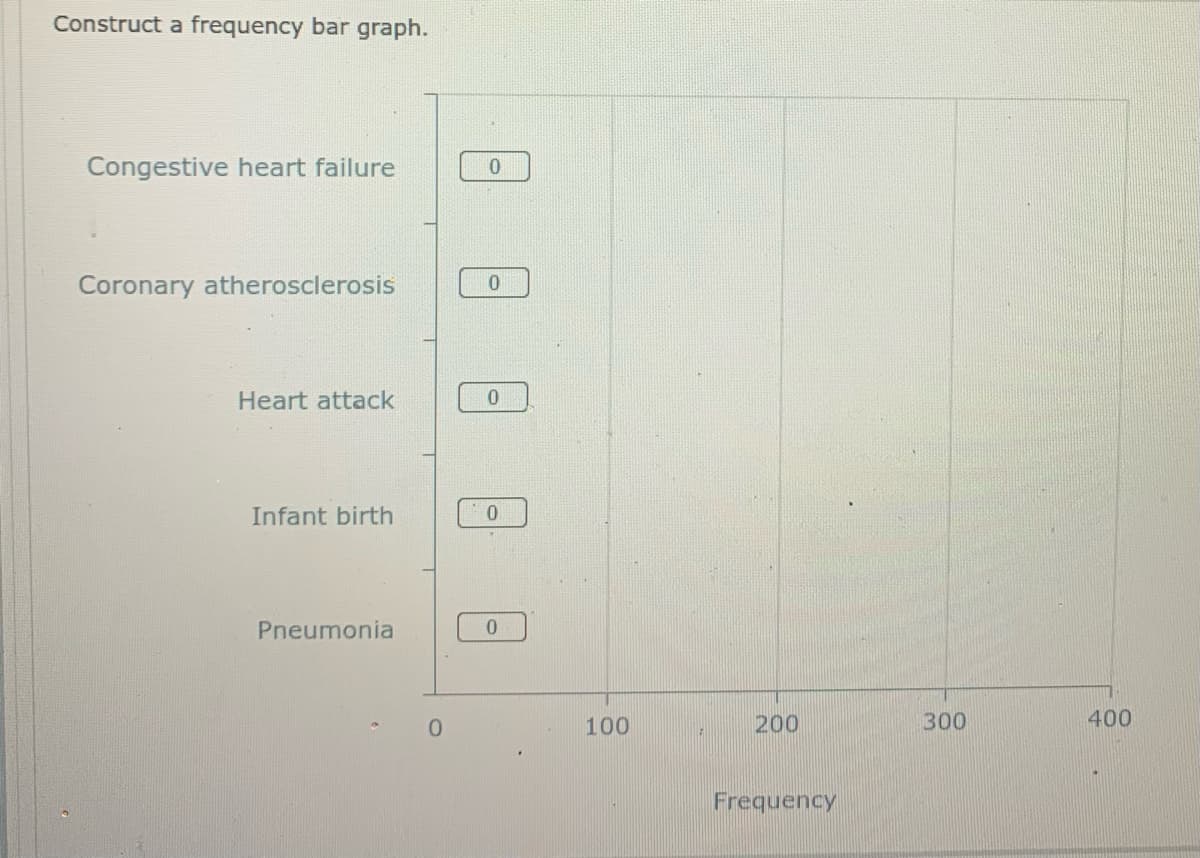
Transcribed Image Text:Construct a frequency bar graph.
Congestive heart failure
Coronary atherosclerosis
Heart attack
Infant birth
Pneumonia
100
200
300
400
Frequency
Expert Solution
Step 1
Given that ;
From the frequency table.
Make a frequency bar graph by using frequency table.

Trending now
This is a popular solution!

Step by step
Solved in 2 steps with 1 images

Recommended textbooks for you
Glencoe Algebra 1, Student Edition, 9780079039897…
Algebra
ISBN:
9780079039897
Author:
Carter
Publisher:
McGraw Hill
Glencoe Algebra 1, Student Edition, 9780079039897…
Algebra
ISBN:
9780079039897
Author:
Carter
Publisher:
McGraw Hill