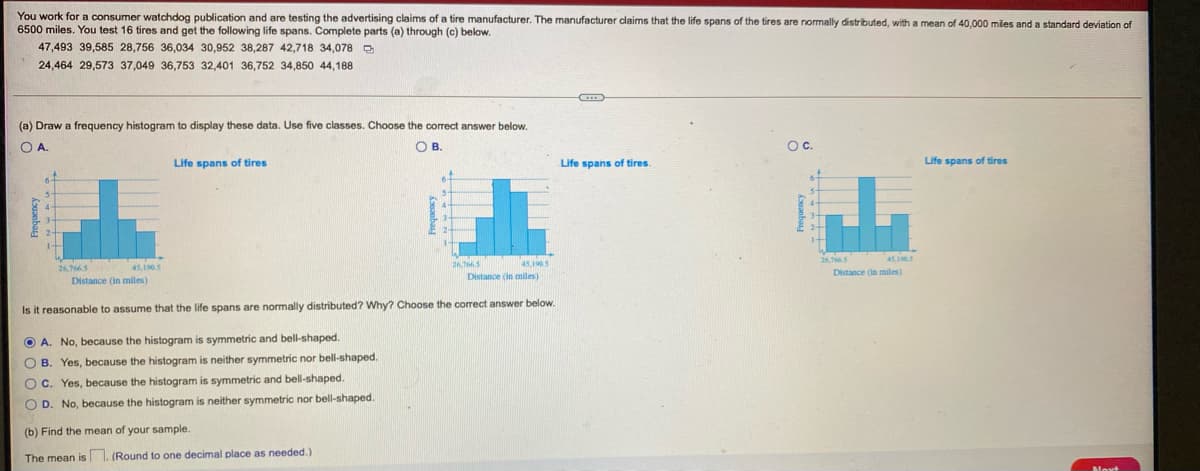
You work for a consumer watchdog publication and are testing the advertising claims of a tire manufacturer. The manufacturer claims that the life spans of the tires are normally distributed, with a mean of 40,000 miles and a standard deviation of 6500 miles. You test 16 tires and get the following life spans. Complete parts (a) through (c) below. 47,493 39,585 28,756 36,034 30,952 38,287 42,718 34,078 D 24,464 29,573 37,049 36,753 32,401 36,752 34,850 44,188 (a) Draw a frequency histogram to display these data. Use five classes. Choose the correct answer below. O A. O B. Oc. Life spans of tires Life spans of tires Life spans of tires 45.1905 45,195 26,7S 45,1905 Distance (in miles) Distance (in miles) Distance (in miles) Is it reasonable to assume that the life spans are normally distributed? Why? Choose the correct answer below. O A. No, because the histogram is symmetric and bell-shaped. O B. Yes, because the histogram is neither symmetric nor bell-shaped. Oc. Yes, because the histogram is symmetric and bell-shaped. O D. No, because the histogram neither symmetric nor bell-shaped. (b) Find the mean of your sample. The mean is 1. (Round to one decimal place as needed.) Noxt
You work for a consumer watchdog publication and are testing the advertising claims of a tire manufacturer. The manufacturer claims that the life spans of the tires are normally distributed, with a mean of 40,000 miles and a standard deviation of 6500 miles. You test 16 tires and get the following life spans. Complete parts (a) through (c) below. 47,493 39,585 28,756 36,034 30,952 38,287 42,718 34,078 D 24,464 29,573 37,049 36,753 32,401 36,752 34,850 44,188 (a) Draw a frequency histogram to display these data. Use five classes. Choose the correct answer below. O A. O B. Oc. Life spans of tires Life spans of tires Life spans of tires 45.1905 45,195 26,7S 45,1905 Distance (in miles) Distance (in miles) Distance (in miles) Is it reasonable to assume that the life spans are normally distributed? Why? Choose the correct answer below. O A. No, because the histogram is symmetric and bell-shaped. O B. Yes, because the histogram is neither symmetric nor bell-shaped. Oc. Yes, because the histogram is symmetric and bell-shaped. O D. No, because the histogram neither symmetric nor bell-shaped. (b) Find the mean of your sample. The mean is 1. (Round to one decimal place as needed.) Noxt

Glencoe Algebra 1, Student Edition, 9780079039897, 0079039898, 2018
18th Edition
ISBN:9780079039897
Author:Carter
Publisher:Carter
Chapter10: Statistics
Section10.4: Distributions Of Data
Problem 19PFA

Related questions
Question
Transcribed Image Text:You work for a consumer watchdog publication and are testing the advertising claims of a tire manufacturer. The manufacturer claims that the life spans of the tires are normally distributed, with a mean of 40,000 miles and a standard deviation of
6500 miles. You test 16 tires and get the following life spans. Complete parts (a) through (c) below.
47,493 39,585 28,756 36,034 30,952 38,287 42,718 34,078 D
24,464 29,573 37,049 36,753 32,401 36,752 34,850 44,188
(a) Draw a frequency histogram to display these data. Use five classes. Choose the correct answer below.
OA.
OB.
Oc.
Life spans of tires
Life spans of tires.
Life spans of tires
45,15
26,
451905
26,75
45,1905
Distance (in miles)
Distance (in miles)
Distance (in miles)
Is it reasonable to assume that the life spans are normally distributed? Why? Choose the correct answer below.
O A. No, because the histogram is symmetric and bell-shaped.
O B. Yes, because the histogram is neither symmetric nor bell-shaped.
O C. Yes, because the histogram is symmetric and bell-shaped.
neither symmetric nor bell-shaped.
O D. No, because the histogram
(b) Find the mean of your sample.
The mean is 1. (Round to one decimal place as needed.)
Noxt
Transcribed Image Text:You work for a consumer watchdog publication and are testing the advertising claims of a tire manufacturer. The manufacturer claims that the life spans of the tires are normally distributed, with a mean of 40,000 miles and a standard deviation of
6500 miles. You test 16 tires and get the following life spans. Complete parts (a) through (c) below.
47,493 39,585 28,756 36,034 30,952 38,287 42,718 34,078
24,464 29,573 37,049 36,753 32,401 36,752 34,850 44,188
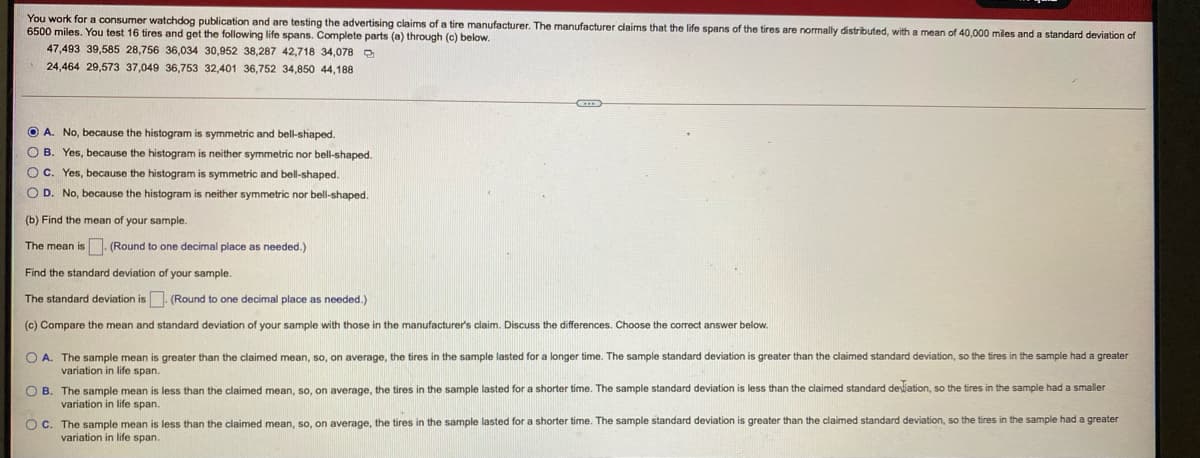
O A. No, because the histogram is symmetric and bell-shaped.
O B. Yes, because the histogram is neither symmetric nor bell-shaped.
OC. Yes, because the histogram is symmetric and bell-shaped.
O D. No, because the histogram is neither symmetric nor bell-shaped.
(b) Find the mean of your sample.
The mean is . (Round
one decimal place as needed.)
Find the standard deviation of your sample.
The standard deviation is. (Round to one decimal place as needed.)
(c) Compare the mean and standard deviation of your sample with those in the manufacturers claim. Discuss the differences. Choose the corect answer below.
O A. The sample mean is greater than the claimed mean, so, on average, the tires in the sample lasted for a longer time. The sample standard deviation is greater than the claimed standard deviation, so the tires in the sample had a greater
variation in life span.
O B. The sample mean is less than the claimed mean, so, on average, the tires in the sample lasted for a shorter time. The sample standard deviation is less than the claimed standard desijation, so the tires in the sample had a smaller
variation in life span.
The sample mean is less than the claimed mean, so, on average, the tires in the sample lasted for a shorter time. The sample standard deviation
variation in life span.
Oc.
greater than the claimed standard deviation, so the tires in the sample had a greater
Expert Solution
Step 1
Hiiiiiii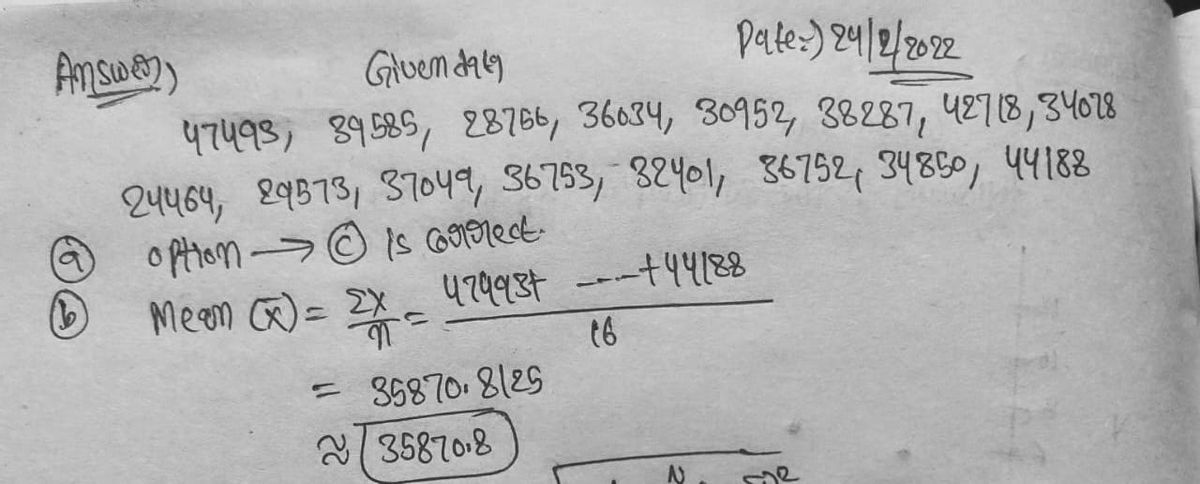

Trending now
This is a popular solution!

Step by step
Solved in 2 steps with 2 images

Recommended textbooks for you
Glencoe Algebra 1, Student Edition, 9780079039897…
Algebra
ISBN:
9780079039897
Author:
Carter
Publisher:
McGraw Hill
Glencoe Algebra 1, Student Edition, 9780079039897…
Algebra
ISBN:
9780079039897
Author:
Carter
Publisher:
McGraw Hill