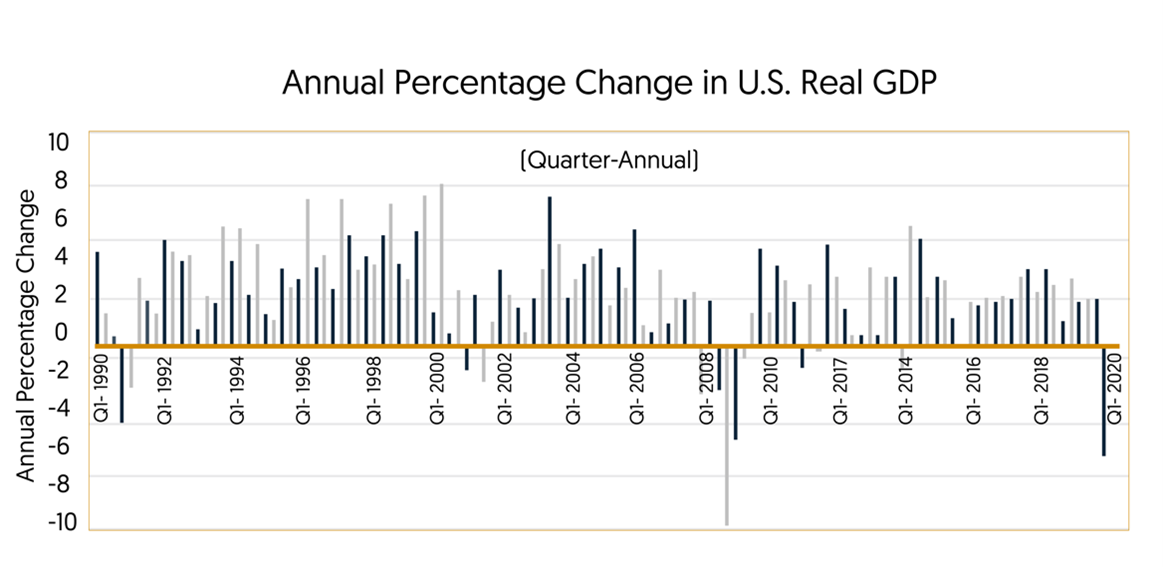
The graph shows the annual GDP growth rate of the United States economy since the first quarter of 1990. According to what was discussed in the course on the phases of the business cycle, how can you represent the concept in this graph? Explain. Without necessarily having numerical data, what level (high or low) of unemployment could have been recorded in some of the periods presented in the graph? Explain your answer indicating why. Without necessarily having numerical data, what level (high or low) of inflation could have been recorded in some of the periods presented in the graph? Explain your answer indicating why. How do you correlate your answers in the previous questions with the phases of economic cycles and their short- and long-term effects? Explain your answer.


The graph shows the annual
According to what was discussed in the course on the phases of the business cycle, how can you represent the concept in this graph? Explain.
Without necessarily having numerical data, what level (high or low) of
Without necessarily having numerical data, what level (high or low) of inflation could have been recorded in some of the periods presented in the graph? Explain your answer indicating why.
How do you correlate your answers in the previous questions with the phases of economic cycles and their short- and long-term effects? Explain your answer.

Step by step
Solved in 3 steps

How do you correlate your answers in the previous questions with the phases of economic cycles and their short- and long-term effects? Explain your answer.


