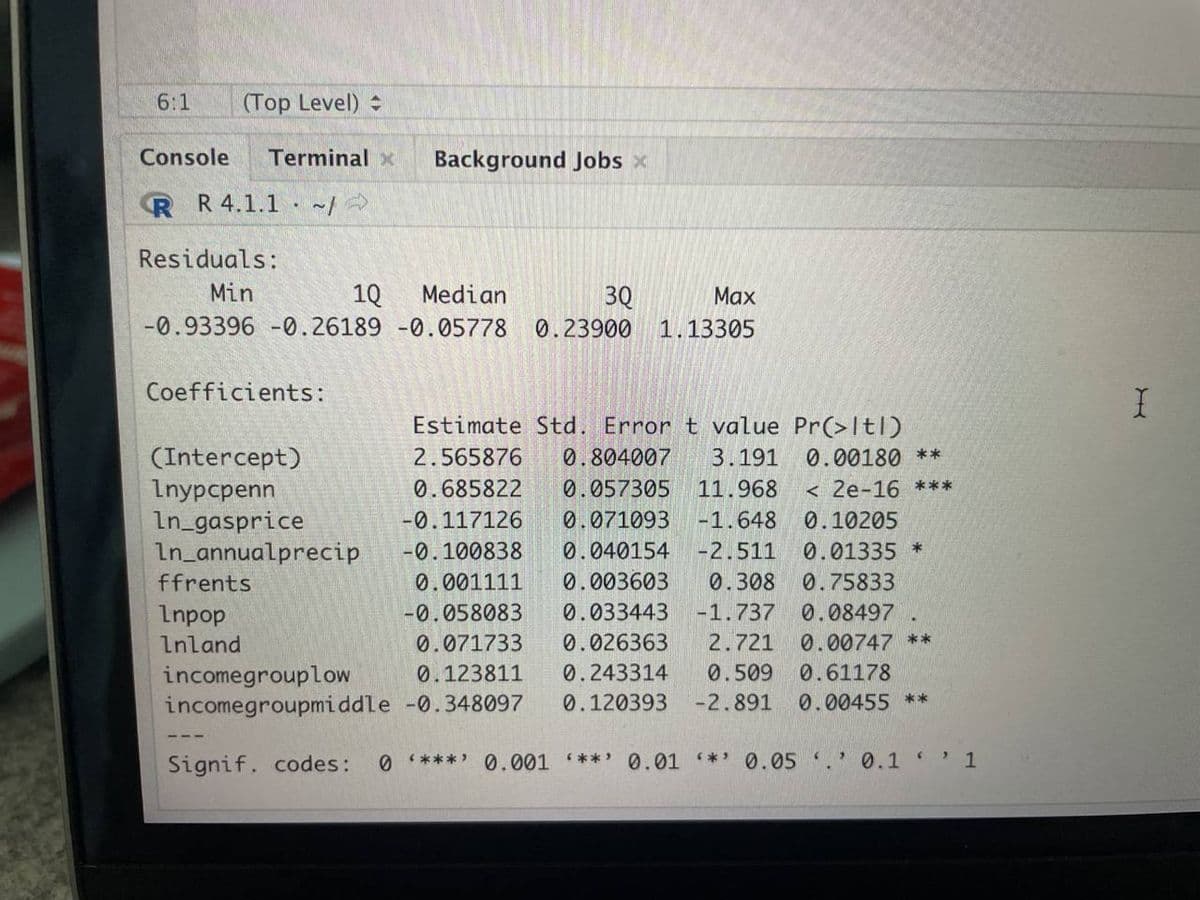
How do you interpret the coefficients for the incomegrouplow and incomegroupmiddle in the photo? (please provide explanation)


Q: To test the functionality of the pit, John and Judy will be making burgers for their friends. Their…
A: The given tree diagram represents the all the possible combinations of burgers from the available…
Q: 0 1 2 3 4 5 6 179 26 2478 15699 368
A: Stem, Leaves 0 6 1 1 7 9 2 2 6 3 2 4 7 8…
Q: R Coefficients: Estimate Std. Error t value Pr(>ltl) 2.565876 0.804007 3.191 0.00180 ** 0.685822…
A: Given R2adjust=0.8503
Q: In a study of 818 randomly selected medical malpractice lawsuits, it was found that 517 of them were…
A: given data n = 818 x = 517 α = 0.05 claim : p > 0.5
Q: The following table show the results of a clinical trial for an allergy drug. Allergy drug Placebo…
A:
Q: This is rejecting Ho when it is true. If the alternative hypothesis says not equal to we know are…
A: We have to match the given definitions with the given terms.
Q: Nationally, about 11% of the total U.S. wheat crop is destroyed each year by hail. An insurance…
A: a) Suppose μ is the population mean percentage of wheat crop lost to hail.
Q: The data represents the heights of eruptions by a geyser. Use the heights to construct a stemplot.…
A:
Q: The histogram shows the number of miles driven by a sample of automobiles in New York City. What is…
A: From the given histogram we only have two labelled class mid points 10000 and 40000. From this class…
Q: 5) Solve for n, given P(2n²,2)=n²(48+10n) Hint: (factor)
A: Given that given P(2n2, 2) = n2 (48 + 10n) We have to solve for n:
Q: It has been said the vitamin C has the ability to cure or prevent the common cold. Residents at a…
A: For the given data (a) Describe how you would conduct a hypothesis test for this case.…
Q: Exhibit 8-1 In order to estimate the average time spent on the computer terminals per student at a…
A:
Q: Below 99 Calculate standard deviation (beg summation method) from the following data: Marks No. of…
A: Measure of dispersion is used to determine the spread of the data. It is used to make summary of the…
Q: The following data were obtained for a sample of 10 persons from a height Example and weight…
A: From the provided information, Sample size (n) = 10 ∑xi = 700, ∑yi = 1550, ∑xi2 = 49120, ∑yi2 =…
Q: A group of adult males has foot lengths with a mean of 28.43 cm and a standard deviation of 1.13 cm.…
A: a group of adults males has foot lenghtswith μ = 28.43 σ = 1.13here we have range rule of…
Q: Which of the following statements is false? Neither distribution has any clear outliers. The…
A: Since you have asked multiple questions, we will solve the first question for you. If you want any…
Q: Consider the following data. 15 22 24 22 17 20 22 26 15 17 18 18 18 22 13 17 16 17 22 24 21 24 15 21…
A: Given data: 15 22 24 22 17 20 22 26 15 17 24 24 24 19 17 18 18 18 22 13 17 16 17 22 24…
Q: Which of the following is not a definition of probabilistic independence? Select one: O a.…
A:
Q: The smallest numeric value in a data set subtracted from the largest is the: a. variance. O b.…
A: We have to find the term which is the difference between the largest value and the smallest value.
Q: What is a scatterplot and how does it help us? Choose the correct answer below. O A. A scatterplot…
A: what is a scatter plot and how does it help us ? Select the correct choice ?
Q: Data in Table 1 shows the number of outpatients who were treated at a local hospital for the month…
A: Given data is:
Q: Let t be the number of years since 1989. What does t=6 mean in this situation
A: In this case, t represents the number of years since 1989.
Q: he following data show the ages of recent award-winning male actors at the time when they won their…
A: here the following data show the ages of recent award winning male actors at the time when they won…
Q: Employees at the Ripley’s Believe It or Not! Museum in Myrtle Beach, South Carolina, declare that…
A: (a) The objective is to identify the hypothesis presented in this story:
Q: Question 6: Answer this. The data below compares the percentage of lessons attended by each student…
A: Box plot is used to measure the spread of the data set. There are three types of box plot, they are…
Q: NO USE Slovin's Formula. Use formula for finite population a) Calculate the sample size of a finite…
A: Hint: The required formula to determine the sample size from a finite population is; n=N1+N. e2 To…
Q: The following data were obtained for a sample of 10 persons from a height Example and weight…
A:
Q: Below Calculate standard deviation (beg summation method) from the following data: Marks No. of…
A: Standard deviation is the measure of dispersion. It used to understand the spread of the data from…
Q: H3. In a given city it rains 25% of the days. A meteorologist has an 80% chance of getting his…
A: Given that, city it rains 25% of the days. A meteorologist has an 80% chance of getting his forecast…
Q: R5.21. Teach for America Several programs attempt to address the shortage of qualified teachers by…
A: Given: x¯1=35.62s1=9.31x¯2=32.48s1=9.43n1=n2=44 Degrees of freedom(df): df=86 X follows two sample…
Q: Is it worth pursuing a doctoral degree in education if you already have an undergraduate degree? One…
A: Given sample size n1=15, sample mean x̄1=31500, s1=sample standard deviations=7900 sample size…
Q: Which would be the most effective method to determine if the mean diameter of the suppliers products…
A: Concept: Whenever we want to check whether the mean claim is being fulfilled or not we use…
Q: How many words can be formed by permutation of the letters of the word DEPRESSION such that each…
A: Given word DEPRESSION We have to calculate No. Of words such that obtained word does not contain 2…
Q: Want to explain these outputs?
A: Normality of the test is used to determine the population follow normal distribution or not. It can…
Q: The question is explain why the “happy” slice makes up 52.5%?
A: Given frequency table Preferred Status Frequency Famous 7 Happy 21 Healthy 4 Ritch 8…
Q: The histogram to the right represents the weights (in pounds) of members of a certain high-school…
A:
Q: If we collect a large sample of blood platelet counts and if our sample includes a single outlier,…
A: If we collect a large sample of blood platelet counts and if our sample includes a single outlier,…
Q: Three students were applying to the same graduate school. They came from schools with different…
A: From the provided information, Student GPA (x) Scholl Average GPA (µ) School standard…
Q: Problem 2: Unprecedented measures have been adopted to control the rapid spread of the ongoing…
A: The question is about identifying types of variable Independent variable : A variable whose effect…
Q: You may need to use the appropriate appendix table or technology to answer this question. According…
A: Given Information: The number of emails received per hour follows a Poisson distribution. The…
Q: ct answer below. al level of measurement is most appropriate beca evel of measurement is most…
A: Statistics uses several levels of measurement, and the data generated by them may be roughly…
Q: Droperidol is a sedative/tranquilizer also used for its anti-nausea properties. Assume the amount of…
A: Solution
Q: A new machine has just been installed to produce printed circuit boards. One of the critical…
A: (a) To determine the control limits for the mean and range.
Q: The line of best fit and the correlation coefficient are calculated for a set of data. The value of…
A: Given that: Correlation coefficient is, r=0.10
Q: 2 X² test for goodness of fit Show that - 2log 2
A: Hint: First find the expected Frequencies for 6 faces. Then, apply the chi-square test of goodness…
Q: A geneticist, in assessing data that fell into two phenotypicclasses, observed values of 250:150. He…
A: Given: Observed values Expected ratio Class Observed a) b) 1 250 3 1 2 150 1 1
Q: Want to explain these outputs?
A: Normality is a test which used to determine the whether the population follows normal distribution…
Q: b) Find the area under the standard normal curve to the right of 21.06 OC
A:
Q: X² test for goodness of fit for Ho based on Po(x)
A: Note: Hi there! Thank you for posting the question. As you have posted multiple questions, as per…
Q: Scores 51-58 59-66 67-74 Class Mark, A 54.5 62.5 70.5 Frequency, 3 7 15
A: The given data is; Scores Class Mark, x Frequency, f 51-58 54.5 3 59-66 62.5 7 67-74 70.5…
How do you interpret the coefficients for the incomegrouplow and incomegroupmiddle in the photo? (please provide explanation)

Step by step
Solved in 2 steps

- Min 1Q Median 3Q Max -18.7823 -0.4865 0.8395 3.0765 7.1123 Coefficients: Estimate Std. Error t value (Intercept) -6.4793 5.5481 -1.168 LAT 0.7515 0.1438 5.228 Pr(>|t|) (Intercept) 0.249 LAT 4.79e-06 *** --- Signif. codes: 0 ‘***’ 0.001 ‘**’ 0.01 ‘*’ 0.05 ‘.’ 0.1 ‘ ’ 1 Residual standard error: 5.498 on 43 degrees of freedom Multiple R-squared: 0.3886, Adjusted R-squared: 0.3744 F-statistic: 27.33 on 1 and 43 DF, p-value: 4.786e-06 What proportion of the variability in the dependent variable RANGE is accounted for by LAT through the regression line? Write the estimated regression function.only define the parameter and write the null and alternative hypotheses The production line for Glow toothpaste is designed to fill tubes with a mean weight of 6 oz.Periodically, a sample of 35 tubes will be selected in order to check the filling process. Qualityassurance procedures call for the continuation of the filling weight for the population of toothpastetubes is 6 ounces; otherwise the processes will be adjusted. Suppose a sample of 35 toothpaste tubesprovides a sample mean of 6.1 oz and standard deviation of 0.2 oz. State the parameter and both hypotheses to help determine whether the filling process should continue operating or be stopped and corrected.Obtain the studentized deleted residuals. Which case has the largest absolute value studentized deleted residual? preferrably using R.
- a) Analytically b) Single application of trapezoidal rule c) Determine the percent relative error based on (a)In construction of scatter plot _____ are used for th x axix regression coefficient Independent variable random variable dependent variableIt is known that the tensile strength of a plastic increases as a function of the time it is subjected to heat treatment. The table below shows the data of the plastic subjected to heat treatment. Determine these data by using the "lagrange interpolation" method by approximating the functions of the lagrange multipliers of L0 , L1 , L2 , L3 and L4 to a 4th order curve. Calculate the tensile strengths of 1.7321 and 2.2361 seconds for each lagrange factor in the function equations of the lagrange multipliers.
- 1.The equation of the least-squres regressioin line 2. which point is outlier 3. remove the outlier and compute the least-square regression line for redicting the president's age from the first lady's age 4. is the outlier influentialTo study the effect of alloying on the resistance of electric wires, an engineer plans to measure the resis-tance of n1 = 35 standard wires and n2 = 45 alloyed wires. If it can be assumed that σ1 = 0.004 ohm andσ2 = 0.005 ohm for such data, what can she assert with98% confidence about the maximum error if she usesx1 − x2 as an estimate of μ1 − μ2? (Hint: Use the result ofExercise 8.)An industrial product is packaged in batches of units each. The number ofdefective units within each batch is unknown. Since checking whether aunit is defective or not is expensive, the quality control consists in selectingunits of the batch and obtaining an estimation of the number of defectiveunits within the batch. The batch is rejected if the estimated number ofdefective units exceeds . a. Find the moment estimator of the number of defective units within aparcel.b. If N=20, n=5, and among these units 2 of them are defective, is thebatch rejected?
- Samples are collected from the River X and pH values are observed. 9 different pH values arelisted in table 3.Table 3Concentrations 4.2 3.8 6.0 3.5 8.1 4.9 4.1 3.2 4.0Draw box plot and finda. Bowley’s coefficient of skewnessb. Karl Pearson’s coefficient of skewnessc. Third momentRubricStages of Process MarksImagine and Plan 2Composition 2Effort 1Find kurtosis using quartile deviation.Assume that last year in a particular state with 700000 children there were 1552 children out of 31500 in a random sample who were diagnosed with Autism Spectrum Disorder. Nationally, 1 out of 88 children are diagnosed with ASD. Is there sufficient data to show that the incident rate of ASD is higher in that state than nationally? Test at the 7% level.P: PARAMETER What is the correct parameter symbol for this problem? What is the wording of the parameter in the context of this problem? H: HYPOTHESES Fill in the correct null and alternative hypotheses: The value of p on this one is a fraction....leave it exact. H0:H0: HA:HA: A: ASSUMPTIONS Since information was collected from each object, what conditions do we need to check? Check all that apply. n(1−pˆ)≥10n(1-p̂)≥10 σσ is unknown. N≥20nN≥20n np≥10np≥10 σσ is known. n(1−p)≥10n(1-p)≥10 n≥30n≥30 or normal population.…