Question 6: Answer this. The data below compares the percentage of lessons attended by each student across 2 maths classes. Class A 9 61 Class B 46 5 98300 6239 98662 17 26 Key: 612= 62% attendance 6641 8 11 2 35688 10 9 022255 a. Calculate the summary statistics for each class (min, Q1, Median, Q3, max). b. Calculate the IQR for each class. c. Describe each class data set in terms of shape, centre and spread.
Question 6: Answer this. The data below compares the percentage of lessons attended by each student across 2 maths classes. Class A 9 61 Class B 46 5 98300 6239 98662 17 26 Key: 612= 62% attendance 6641 8 11 2 35688 10 9 022255 a. Calculate the summary statistics for each class (min, Q1, Median, Q3, max). b. Calculate the IQR for each class. c. Describe each class data set in terms of shape, centre and spread.

Big Ideas Math A Bridge To Success Algebra 1: Student Edition 2015
1st Edition
ISBN:9781680331141
Author:HOUGHTON MIFFLIN HARCOURT
Publisher:HOUGHTON MIFFLIN HARCOURT
Chapter9: Solving Quadratic Functions
Section: Chapter Questions
Problem 4CA

Related questions
Question
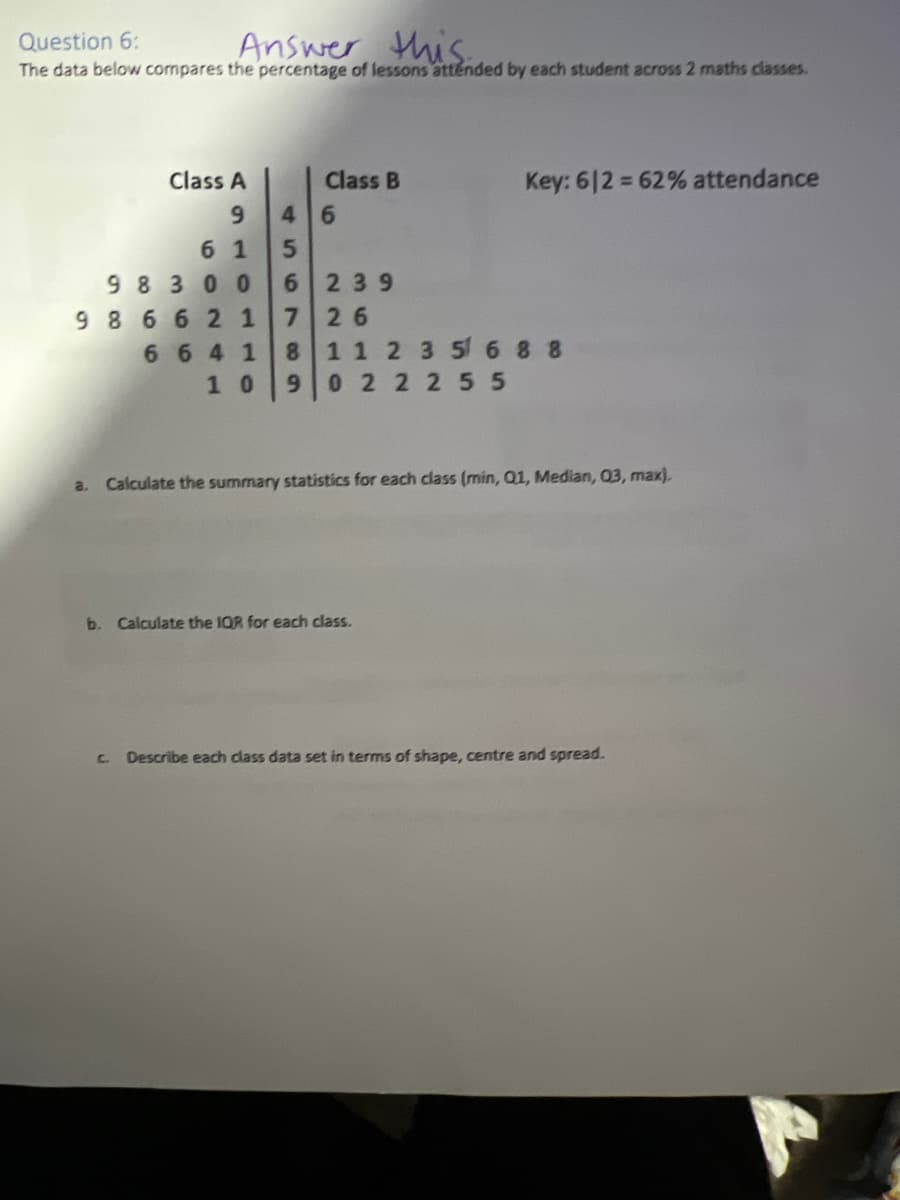
Transcribed Image Text:Question 6:
Answer this..
The data below compares the percentage of lessons attended by each student across 2 maths classes.
Class A
9
61 5
98 300 6
239
98662 1 7 26
Class B
4 6
Key: 612= 62% attendance
6641 8 1 1 2 3 5 688
10 9 022255
a. Calculate the summary statistics for each class (min, Q1, Median, 03, max).
b. Calculate the IQR for each class.
C. Describe each class data set in terms of shape, centre and spread.
Expert Solution
This question has been solved!
Explore an expertly crafted, step-by-step solution for a thorough understanding of key concepts.

Step by step
Solved in 4 steps with 1 images

Recommended textbooks for you
Big Ideas Math A Bridge To Success Algebra 1: Stu…
Algebra
ISBN:
9781680331141
Author:
HOUGHTON MIFFLIN HARCOURT
Publisher:
Houghton Mifflin Harcourt

Glencoe Algebra 1, Student Edition, 9780079039897…
Algebra
ISBN:
9780079039897
Author:
Carter
Publisher:
McGraw Hill
Big Ideas Math A Bridge To Success Algebra 1: Stu…
Algebra
ISBN:
9781680331141
Author:
HOUGHTON MIFFLIN HARCOURT
Publisher:
Houghton Mifflin Harcourt
Glencoe Algebra 1, Student Edition, 9780079039897…
Algebra
ISBN:
9780079039897
Author:
Carter
Publisher:
McGraw Hill