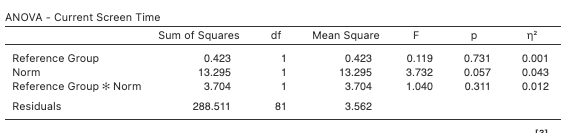
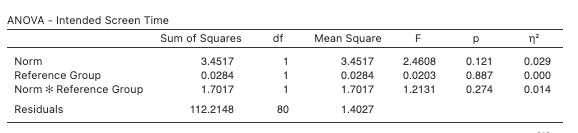
How do you write up the results between these two data sets using APA form


Q: Describe the difference in roles assumed by the validation partion and test partition in data mining…
A: Data mining is the process of extracting important information from large amount of data.
Q: WHAT IS ROUND OFF ERROR? HOW ROUND OFF ERROR iIS USED?
A: A roundoff error's second name is rounding error.
Q: Please group these statistical notations/concepts into two groups, those related to samples and…
A: Given information: Some statistical notations/concepts are provided as: Parameter, n, σ2, Statistic,…
Q: What steps do I take on SPSS to do data screening for a T-Test?
A: For a T-test, the following assumptions are to be met and verified which is given by: Continuos…
Q: How do I use Excel to calculate the SAMPLE VARIANCE of a column?
A: The sample variance of a column data can be obtained using excel function as follow: Enter the data…
Q: What are the shapes of these histograms
A: Introduction: A histogram is said to be symmetric if the distribution to the right of its center is…
Q: what is the least squares mean ADG for Hereford
A: Given :We have given the data of angus and Hereford We first find the mean for angus and Hereford…
Q: The height and arm span of a sample of 50 teenagers Identify the explanatory variable and the…
A: Here we have to identify the explanatory variable and response variable
Q: Statistical inference deals with methods of inferring or drawing _______ about the characteristics…
A: Given: Statistical inference deals with methods of inferring or drawing _______ about the…
Q: How to build a histogram based on this data
A: Histogram is the graph that helps to visualize the categorical data. It helps to undertsand the…
Q: What is the factorization theorem in statistic ?
A: The necessary and sufficient condition for a distribution to admit sufficient statistic is provided…
Q: The differences for both Roles 6 and 7 are statistically significant. For which one of these roles…
A: Given: Role 6: Vocational Interest Testing t test statistic = -2.14 Role 7: Academic Scheduling t…
Q: What is the correlation coefficient and what is its significance? Explain why correlation…
A: Correlation: Correlation a measure which indicates the “go-togetherness” of two data sets. It can be…
Q: what is the z score formula and and reverse z score formula ?
A:
Q: how do i find quartile 1 in a set of data?
A: First quartile: The first quartile is the middle-most observation or median of the lower half of the…
Q: (a) Differentiate between single imputation and multiple imputation. (b) Illustrate THREE (3) types…
A: a)
Q: 12. Normally distributed data are referred to as:
A:
Q: How do I go through the data screening process using 2 categorial and 2 quantitative variables?
A: Data screening for categorical variables:1. Check for Missing data.2. Test for association among the…
Q: Identify two main types of graphical displays that are used for qualitative data.
A: Qualitative variable: A variable that is used for classification of individuals based on some…
Q: The height and arm span of a sample of 50 teenagers Identify the explanatory variable and the…
A: An explanatory variable, also known as independent variable or predictor variable as it is used to…
Q: Explain why the main effects in a factorial study may not provide an accurate description of the…
A:
Q: What is the chi square-crit for the alpha level of .05 when you have 5 column categories and 5 row…
A: Given : alpha level of 0.05 we have 5 column categories and 5 row categories (5x5 grid)
Q: Describe the procedure for defining a variable and rules for data codingin SPSS.
A: The procedure for defining a variable in SPSS are as follows: 1) The first step is to click on the…
Q: How are power, alpha, and type 1 and type 2 error all related?
A: Type 1 error is the error of rejecting a true null hypothesis. This happens when the value of the…
Q: 6. What are graph and diagrams? What are the importance and limitation of diagrammatic ar graphical…
A: Graphs are used to represent statistical data. It visulaizes how two or more variables that are…
Q: Which are the steps involved in the construction of explanatory bivariate tables?
A: Explanatory Bivariate table: A Statistical technique intended to recognize and portray the…
Q: What are process data?
A: Process data: The data that are arranged based on the time sequence is termed as process data. They…
Q: How many cases are there in this dataset? i How many variables are there in this dataset? i
A: F=FEMALE M=MALE Case Gender Number of days to cross the Atlantic Ocean 1 M 40 2 M 87 3 M 78…
Q: Define panel data. What is the advantage of using such data to make statistical and economic…
A:
Q: A survey was conducted to determine whether age affects the level of development oriented of mayors…
A: Given: observed frequency oi High average low total Young 30 20 5 55 Old 6 13 26 45…
Q: what is the difference between grouped and ungrouped data?
A: Data can be classified as grouped data and ungrouped data.
Q: Explain Univariate Analysis?
A: Univariate Analysis is the analysis of variable. As the name suggests 'uni' means one i.e analysis…
Q: Explain how Pearson's Coefficient is utilized to determine the shape of data.
A: Value of Pearson's coefficient of skewness describes the shape of the distributon. As a general rule…
Q: What is the difference between the types of data 1- categorical data, 2- numerical data, with an…
A: In statistics, various types of data are studied. There are two types of data that are mainly…
Q: A chi-square test was performed on data to determine whether the age of a driver, 21 years or older,…
A:
Q: What differentiates methods of collecting data in a research?
A: Research data is any information that has been collected, observed, generated or created to validate…
Q: How do I create a symmetrical data table? Like how do I know if it’s symmetrical?
A: If the data are symmetric, they have about the same shape on either side of the middle. In other…
Q: The Commissioner of Health in New York State wanted to study malpractice litigation in New York. A…
A: A sample statistic is a piece of information you get from a fraction of a population. The statistic…
Q: What is the difference between Discrete and Continous Data and prodivde an example for each.
A: Discrete random variable : Random variables that can assume only a countable number of values are…
Q: What does a z-score of 3 for a data value x represent? What does a x score of -1 for a data value x…
A: We have to interpret z scores.
Q: Starting salaries of new accounting graduates would differ according to geographic regions of the…
A:
Q: Starting salaries of new accounting graduates would differ according to geographic regions of the…
A:
Q: Describe how we can enhance the potential validity (internal and external) of a qualitative research…
A: In order to enhance the potential validity of a quality research project, both internal and…
Q: Explain the differences between independent samples and dependent samples as it applies to…
A: We have to differentiate between independent sample and dependent sample in hypothesis testing.
Q: UIIT is giving two training programmes. Two groups from BSSE were trained for the same task. For the…
A: Given, Programme A Mean,μ1=28.74variance , σ12=79.39standard deavition , σ1=σ12=8.91 Programme B…
Q: What are the advantages of using paired data tests? Explain. Provide another example of using…
A: Paired samples (also called dependent samples or data sets) are ones in which natural or matched…
Q: how do I find the variance?
A: Population variance is the measure of variability of the data that is how far away our data points…
Q: 3, 5, 5, 4, 2, 2, 1, 1, 1, 4, 5, 3, 3 calculate variance
A: Given that The data are 3, 5, 5, 4, 2, 2, 1, 1, 1, 4, 5, 3, 3
How do you write up the results between these two data sets using APA formatting?


Trending now
This is a popular solution!

Step by step
Solved in 3 steps

- What is a sample space?Is the high school dropout rate higher for males or females? A random sample of population regions gave the following information about percentage of 15- to 19-year-olds who are high school dropouts. (Reference: Statistical Abstract of the United States, 121st edition.) Region 1 2 3 4 5 6 7 8 9 10 Male 7.8 7.1 7.6 21.9 4.1 12.5 3.6 4.7 8.1 9.6 Female 7.4 6.5 6.2 20.5 2.3 5.6 3.7 4.4 12.2 10.9 Region 11 12 13 14 15 16 17 18 19 20 Male 14.3 3.9 3.7 4.8 5.4 6.6 15.2 6.6 8.3 6.4 Female 15.9 6.8 4.1 3.5 9.9 9.4 12.7 3.8 3.8 8.3 Does this information indicate that the dropout rates for males and females are different (either way)? Use α = 0.05. (a) What is the level of significance? (b) Compute the sample test statistic. (Use 2 decimal places.) (c) Find the P-value of the sample test statistic. (Use 4 decimal places.)A bank with a branch located in a commercial district of a city has the business objective of improving the process for serving customers during the noon-to-1 PM lunch period. To do so, the waiting time (defined as the number of minutes that elapses from when the customer enters the line until he or she reaches the teller window) needs to be shortened to increase customer satisfaction. Another bank in the area is also concerned with the noon-to-1 PM lunch period. A random sample of 12 customers is selected from each bank and the waiting times are the following: Bank 1: 4.02 4.13 4.05 4.09 3.2 3.79 4.95 4.74 4.29 4.7 3.8 3.18 Bank 2: 2.28 3.85 1.61 3.25 2.82 2.61 3.93 2.13 3.03 1.89 3.7 2.45 Is there evidence of a difference in the variability of the waiting time between the two branches? (alpha = 0.05) a. What are the null and alternate hypotheses? H0: H1:…
- A bank with a branch located in a commercial district of a city has the business objective of improving the process for serving customers during the noon-to-1 PM lunch period. To do so, the waiting time (defined as the number of minutes that elapses from when the customer enters the line until he or she reaches the teller window) needs to be shortened to increase customer satisfaction. Another bank in the area is also concerned with the noon-to-1 PM lunch period. A random sample of 12 customers is selected from each bank and the waiting times are the following: Bank 1: 4.02 4.13 4.05 4.09 3.2 3.79 4.95 4.74 4.29 4.7 3.8 3.18 Bank 2: 2.28 3.85 1.61 3.25 2.82 2.61 3.93 2.13 3.03 1.89 3.7 2.45 Is there evidence of a difference in the variability of the waiting time between the two branches? (alpha = 0.05) c. Compute the value of the test statistic? (Round your answer to 2 decimal places. Negative values should have a minus sign in front of them) d.…A bank with a branch located in a commercial district of a city has the business objective of developing an improved process for serving customers during the noon-to-1 p.m. lunch period. Management decides to first study the waiting time in the current process. The waiting time is defined as the time that elapses from when the customer enters the line until he or she reaches the teller window. Data are collected from a random sample of 35 customers. Suppose that another branch, located in a residential area, is also concerned with improving the process of serving customers in the noon-to-1 p.m. lunch period. Data are collected from a random sample of 40 customers. The obtained data from the two branches are stored. At the 5% significance level, is there evidence of a difference in the mean waiting time between the two branches? What is/are implications of the result?#2.The Gallup organization periodically polls adults living in the U.S. about the issue ofimmigration. Participants are asked whether they think immigration should increase,decrease, or stay at present levels. When this question was asked in June of 2016, 38%of respondents said they thought immigration should decrease. When it was asked inJune of 2018, 29% of respondents said they thought immigration should decrease.For the purpose of this problem, suppose that the sample size was 200 in both 2016 and2018, and that each represented a simple random sample of adults living in the U.S. atthat time. Is there evidence for a real change in opinion among U.S. adults between2016 and 2018, or do you think the results are just due to chance? Carry out all thesteps for a two-sample z test and state your conclusion. Suppose I had told you in #2 that the same people had been surveyed in 2016 and 2018.What’s the problem with carrying out the two-sample z test in this case?
- Simple random sampling: is used when there is a need to emphasize one or more types of population items. requires both input and output parameters to be set when using a random number generator. is generally used with replacement sampling. is a probabilistic sampling method.The state of Georgia's HOPE scholarship program guarantees fully paid tuition to Georgia public universities for Georgia high school seniors who have a B average in academic requirements as long as they maintain a B average in college. It was reported that 73 out of the 137 randomly selected students entering Ivan Allen College at Georgia Tech (social science and humanities) with a HOPE scholarship lost the scholarship at the end of the first year because they had a GPA of less than 3.0. It was also reported that 72 of a random sample of 111 students enterin the College of Computing with a B average had lost their HOPE scholarship by the end of the first year. Is there convincing evidence that the proportion who lose HOPE scholarships is different for the College of Computing than for the Ivan Allen College? (Use the 4-step process) State: Plan: Do: Conclude: b)Given your conclusion above, which type of error, Type I or Type II, is it possible to make? Describe that error in the…The data processing department of the Arizona Bank has five data entry clerks. Each working day their supervisor verifies the accuracy of a random sample of 250 records. A record containing one or more errors is considered defective and must be redone. The results of the last 30 samples are shown in the table. All were checked to make sure that none was out of control. Sample Number of DefectiveRecords Sample Number of DefectiveRecords Sample Number of DefectiveRecords Sample Number of DefectiveRecords 1 2 3 4 5 6 7 8 7 5 19 10 11 8 12 9 9 10 11 12 13 14 15 16 6 13 18 5 16 4 11 8 17 18 19 20 21 22 23 12 4 6 11 17 12 6 24 25 26 27 28 29 30 Total 7 13 10 14 6 11 9 300 a. Based on these historical data, set up a p-chart using z = 3.b. Samples for the next 4 days showed the following: Sample Number of Defective Records Tues Wed Thurs Fri 17 15 22 21 What is the supervisor’s assessment of the data-entry process likely to be?

