How does the variation in Rice Hull Ash and admixture addition affect the compressive strength? Which of them has the stronger influence on the compressive strength?


Q: What are the explanatory variable and response variable for this relationship?
A: Given that among a group of 138 customers aged 14-23 who send more text messages tend to use a…
Q: What are the criteria and steps needed to take to asses the degree in which an independent variable…
A: The degree in which an independent variable causes changes observed in the dependent variable is the…
Q: If there is a main effect of maternal diet (alcohol vs non alcohol), is the main effect of maternal…
A: From the above figure, the significance value for diet variable is '0' which means there is no…
Q: A simple main effect test is appropriate for analyzing which significant result?
A: Simple Effects : is appropriate for analyzing a significant interaction, follow-up tests are…
Q: What is the coefficient of determination for the data above?
A: Step-by-step procedure to find the regression line using Excel: In Excel sheet, enter x and y in…
Q: Krista wants to compare males and females on number of hours of physical activity done per week. If…
A: The number of hours Physical activity done by males are collected. Similarity the number of hours of…
Q: What is the effect size?
A: Effect size measures the strength of the relationship between two variables on a numeric scale. For…
Q: Find the relative risk for the headache data.
A: here use given information , For treatment group n = 2142 x= 22 (reported headache) for control…
Q: The length of an injection- molded plastic case that holds magnetic tape is normally distributed…
A:
Q: What is the slope coefficient for the weight variable? Is this coefficient significant at 5% level…
A: Consider that β1 is the slope coefficient corresponding to weight variable.
Q: Part A: Does the mean E. coli contamination differ significantly among the four months? Justify your…
A: SS between months = SSmonths = 5992.500 The error sum of the square is given by ESS = 18568.5 -…
Q: Suppose we want to use systolic blood pressure to predict diastolic blood pressure. The explanatory…
A: Solution
Q: What is the R^2 value and describe tue strength of tue correlation
A: r squared is the percentage of variation explained by the relationship between two variables(age and…
Q: What is the expected or average paint thickness?
A: Answer: Given that the random variable X measures the thickness of the paint in millimeters at a…
Q: What does Fse test for simple effects tests?
A: The effect of one independent variable on the dependent variable is called simple effect or main…
Q: Explain the graphic method of determining correlation between two variables?
A: Correlation: Correlation a measure which indicates the “go-togetherness” of two data sets. It can be…
Q: How is the number of degrees of freedom available for estimating , the variance of ε, related to the…
A: Let n be total number of variables k be number of independent variables
Q: Did the authors note any differences in gender with regard to fish consumption and inflammatory…
A: HI, as per our policy, we'll answer the first three subparts for you. Given:
Q: Which explanatory variable (hormone x or hormone w) has a stronger relationship with the response…
A: Here it is given that there are two sets of bivariate data collected from animals over the last…
Q: To examine bivariate data graphically, the best choice is two side by side histograms? Define this…
A: Introduction: A histogram is a graphical display mainly used to plot a univariate continuous…
Q: Why shouldn't you extrapolate and how to deal with samples reading out the dynamic range?
A: Extrapolation is prediction far outside the range of the data. These predictions may be incorrect if…
Q: Construct a scatter plot for these data. Based on the scatter plot, how would you describe the…
A: Given: x y 11 120 15 150 12 130 14 140 13 130 10 110 15 160 10 100
Q: a) Determine the proportion of wafers that exceeds 0.2125 micrometers of photoresist thickness.…
A: Here Given the thickness of photoresist applied to wafers are uniformly distribute between 0.2069…
Q: The average value of the residuals is
A: Residual is the error happen in the observation. It is calculated by subtracting the observed and…
Q: What is the scale factor of the dilation if AFHG ~ AFED?
A:
Q: As the alpha level gets lower, which error rate also gets lower? Type I Type II
A: We know that, Type I error is – In this we reject the null hypothesis which is actually true called…
Q: erik measured the area of scallops in two places in florida and used an appropriate hypothesis test…
A: type 2 error means accepting null hypothesis when it is actually false H0 : there is no difference…
Q: Define Bivariate Relationships?
A: Bivariate Relationship is a common statistical method.
Q: how do I describe the "measures of center and variability" of a chart?
A: The commonly used measures of center tendency are, Mean Median Mode In charts like histogram, the…
Q: Which are the steps involved in the construction of explanatory bivariate tables?
A: Explanatory Bivariate table: A Statistical technique intended to recognize and portray the…
Q: what is meant by significance level . how is this related to alpha
A: Significance level - The significance level is denoted by in alpha (α) .it is a measure…
Q: What is the advantage of using the Pearson Product Moment Correlation Coefficient over the use of…
A: Correlation: It measures the linear relationship between two variables.
Q: The average time in years to get an undergraduate degree in computer science was compared for men…
A: The provided information is The average time in years to get an undergraduate degree in computer…
Q: Shark scientists are interested in whether the magnitude of hammer-head shark migration is related…
A: It is given that the, Shark scientists are interested in whether the magnitude of hammer-head shark…
Q: determine if the frequency of deficiencies of variable (medication errors) are statistically…
A: Given information: The output for Chi-square test for independence is given.
Q: (a) Determine the mean and variance of the coating thickness. (b) If the coating costs $0.50 per…
A:
Q: Rebecca is investigating if height has any effect on red blood cell count. What is the response…
A:
Q: Explain difference between three formulas that are used in t-test for two samples with real life…
A: The different types used in t-test for two samples are: Independent t-test (unpaired data) which is…
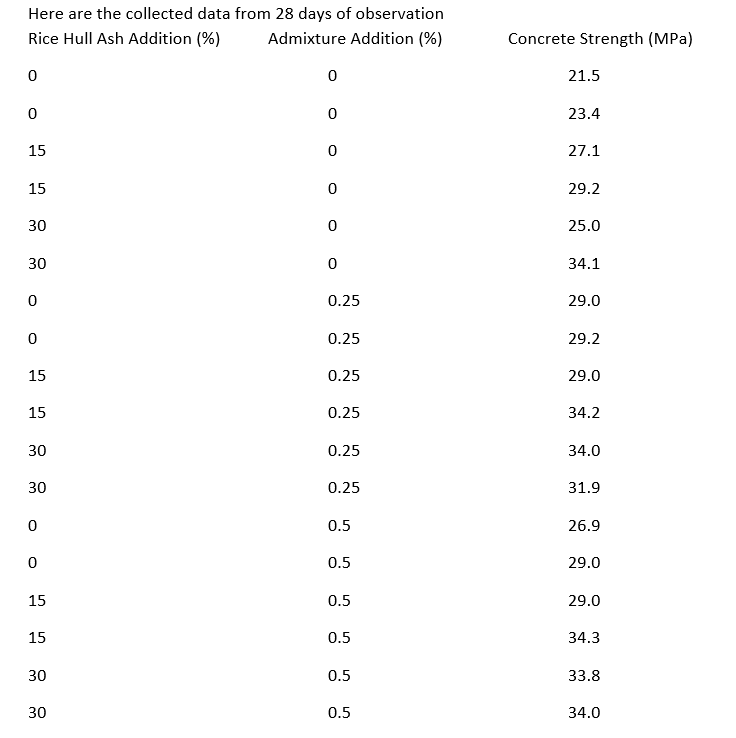
Q: Does the admixture affect the compressive strength? How? Please use hypothesis testing or…
A: Consider the provided data: Rice Half Addiction Admixtures Addition Concrete Strength 0 0 21.5…
Q: What type of data would you use for collecting data on lap swim time
A: Continuous Data represents measurements and therefore their values can’t be counted but they can be…
Q: What are soft stats?
A: There are two types of data/statistics. Hard data and soft data/ statistics/number. Hard data are…
Q: The extent of disease transmisSion can be affected greatly by the viability of infectious organisms…
A: The given data is, Class Time,x(in minutes) Biological Recovery(%) 1 0 70.6 2 5 52 3 10…
Q: What is the scale factor of the dilation if AFHG ~ AFED?
A: we know that dilation is a transformation that produces an image that is the same shape as the…
Q: What are composite areas?
A:
Q: = Mean of Seedling Characteristics of Wheat Cultivars Affected by Different Level of Salilly
A: Given information: The table represents the mean of seedling characteristics of wheat cultivars that…
Q: explain this Histogram and gaves more information and how the resistance data appear to be normally…
A: Histogram are used to visualize the data set, it helps to understand the spread of data and the…
Q: In a certain study, the effect on oat yield was compared for the Pallinup, Overberg and Magnifico…
A: Consider the given study ,in which effect on oat yield was compared for 3 different varieties of…
Q: Based on this excerpt, determine the sensitivity and specificity of using a "hand on the forehead"…
A: here sensitivity and specificity of experiment to be determined ..experiment is touching hand and…
Q: _______________ is the ability to detect a significant difference or relationship and is influenced…
A: Power of a test: Power of a test is the probability of rejecting a null hypothesis when it is…
How does the variation in Rice Hull Ash and admixture addition affect the compressive strength? Which of them has the stronger influence on the compressive strength?

Step by step
Solved in 2 steps with 2 images

- An analysis was conducted by the Statistics Consulting Center atVirginia Polytechnic Institute and State University in which acertain treatment was applied to a set of tree stumps. The chemicalGarlon was used the with the purpose of regenerating the roots ofthe stumps. A spray was used with four levels of GarlonPage 23 of 23concentration. After a period of time the height of the shoots wasobserved. Does the concentration of Garlon has a significantimpact on the height of the shoots? Use α = 0.05.In this study, the protection of aquatic ecosystems is an important goal of Ville de Montréal. In particular, Thomas wants to see whether the contamination of creeks (ruisseaux in French) by Escherichia coli differs among the months of May, June, July, and August. Therefore, herandomly samples six creeks in different areas. For each creek, he collects water samples from May to August, and measures the amount of E. coli, expressed in colony-forming units (CFU) per 100 mL of water. For each combination of a month and a creek, he thus obtains an E. coli contamination value, i.e., 24 observations in total. A preliminary statistical analysis produces the following results. Which pairs of months show significant differences in mean E. coli contamination? Explain your reasoning and justify your answer to this question with the results of a statistical procedure. Use α = 0.05.In this study, the protection of aquatic ecosystems is an important goal of Ville de Montréal. In particular, Thomas wants to see whether the contamination of creeks (ruisseaux in French) by Escherichia coli differs among the months of May, June, July, and August. Therefore, herandomly samples six creeks in different areas. For each creek, he collects water samples from May to August, and measures the amount of E. coli, expressed in colony-forming units (CFU) per 100 mL of water. For each combination of a month and a creek, he thus obtains an E. coli contamination value, i.e., 24 observations in total. A preliminary statistical analysis produces the following results. Which pairs of months show significant differences in mean E. coli contamination? Explain your reasoning and justify your answer to this question with the results of a statistical procedure. Use α = 0.05. Data: May= 66, June= 104, July=105, August= 88
- In this study, the protection of aquatic ecosystems is an important goal of Ville de Montréal. In particular, Thomas wants to see whether the contamination of creeks (ruisseaux in French) by Escherichia coli differs among the months of May, June, July, and August. Therefore, herandomly samples six creeks in different areas. For each creek, he collects water samples from May to August, and measures the amount of E. coli, expressed in colony-forming units (CFU) per 100 mL of water. For each combination of a month and a creek, he thus obtains an E. coli contamination value, i.e., 24 observations in total. A preliminary statistical analysis produces the following results. Part A: Does the mean E. coli contamination differ significantly among the four months? Justify your answer to this question with the result of a statistical test. Use α = 0.05. Part B:Which pairs of months show significant differences in mean E. coli contamination? Explain your reasoning and justify your answer to this…how to find that which type of kurtosis is represent by the curve in sample distribution.In this study, the protection of aquatic ecosystems is an important goal of Ville de Montréal. In particular, Thomas wants to see whether the contamination of creeks (ruisseaux in French) by Escherichia coli differs among the months of May, June, July, and August. Therefore, he randomly samples six creeks in different areas. For each creek, he collects water samples from May to August, and measures the amount of E. coli, expressed in colony forming units (CFU) per 100 mL of water. For each combination of a month and a creek, he thus obtains an E. coli contamination value, i.e., 24 observations in total. A preliminary statistical analysis produces the following results. 13-a) Does the mean E. coli contamination differ significantly among the four months? Justify your answer to this question with the result of a statistical test. Use α = 0.05. 13-b) Which pairs of months show significant differences in mean E. coli contamination? Explain your reasoning and justify your answer…
- Two subspecies of dark-eyed juncos were studied by D. Cristol et al. One of the sub- species migrates each year, and the other does not. Several characteristics of 14 birds of each subspecies were measured, one of which was wing length. The following data, based on the results of the researchers, provide the wing lengths, in millimeters, for the samples of two subspecies. Assume that wing lengths in populations of subspecies are normally distributed.Migratory: n = 14, x ̄ = 82.1, s = 1.5 111Non-migratory: n = 14, x ̄ = 84.92, s = 1.69 222Conduct a hypothesis test to determine if the average wing lengths in two populations of subspecies are significantly different.(i.) State the hypotheses.(ii.) Test for equality of unknown population variances. (iii.) Calculate test statistic.(iv.) Calculate degrees of freedom.(v.) Calculate the p−value of the test.(vi.) State your decision based on the p−value.(vii.) Write the interpretationThe defective percentage of bricks produced by a certain process is 20%. A new method isintroduced which is supposed to reduce the defective percentage. 150 bricks produced by thismethod showed 27 of them are defective. Does this data support the above claim at significancelevela = 0.01?The article “Measuring and Understanding the Aging of Kraft Insulating Paper in Power Transformers” (IEEE Electrical Insul. Mag., 1996: 28– 34) contained the following observations on degree of polymerization for paper specimens for which viscosity times concentration fell in a certain middle range: 418, 434, 454, 421, 437, 463, 421, 439, 465, 422, 446, 425, 447, 427, 448, 431, 453 (a) Calculate a 99% confidence interval for the true average degree of polymerization. (b) Does the confidence interval suggest that μ = 435 is a plausible value for the true average degree of polymerization? (c) Does the confidence interval suggest that μ = 460 is a plausible value for the true average degree of polymerization?
- Vertical banded gastroplasty is a surgical procedure that reduces the volume of thestomach in order to produce weight loss. In a recent study, 82 patients with Type 2 diabetes underwent this procedure, and 59 of them experienced a recovery from diabetes. Does this study provide convincing evidence that the percentage of those with diabetes who undergo this surgery will recover from diabetes differs from 74%? State the null and alternate hypotheses and use the α=0.05 level of significance and thecritical value methodSuppose that in the previous semester, the percentages of students in the five sections of ECO 204 were 20%, 21%, 19%, 15% and 25%. However, in the current semester, among a sample of 200 students, the student distribution among five sections is 51, 49, 30, 20 and 50. Can we conclude that there has been a statistically significant change in the student proportions?Twenty-five samples, each of size 5, were selected from a process that was in control. Thesum of all the data collected was 677.5 pounds.a. what is an estimate of the process mean (in terms of pounds per unit) when theprocess is in control?


