How importance are financial statements and ratios in today’s current financial and economic environment of 2021. There should be plenty to discuss here.
How importance are financial statements and ratios in today’s current financial and economic environment of 2021. There should be plenty to discuss here.

Chapter1: Financial Statements And Business Decisions
Section: Chapter Questions
Problem 1Q

Related questions
Question
100%
How importance are financial statements and ratios in today’s current financial and economic environment of 2021. There should be plenty to discuss here.
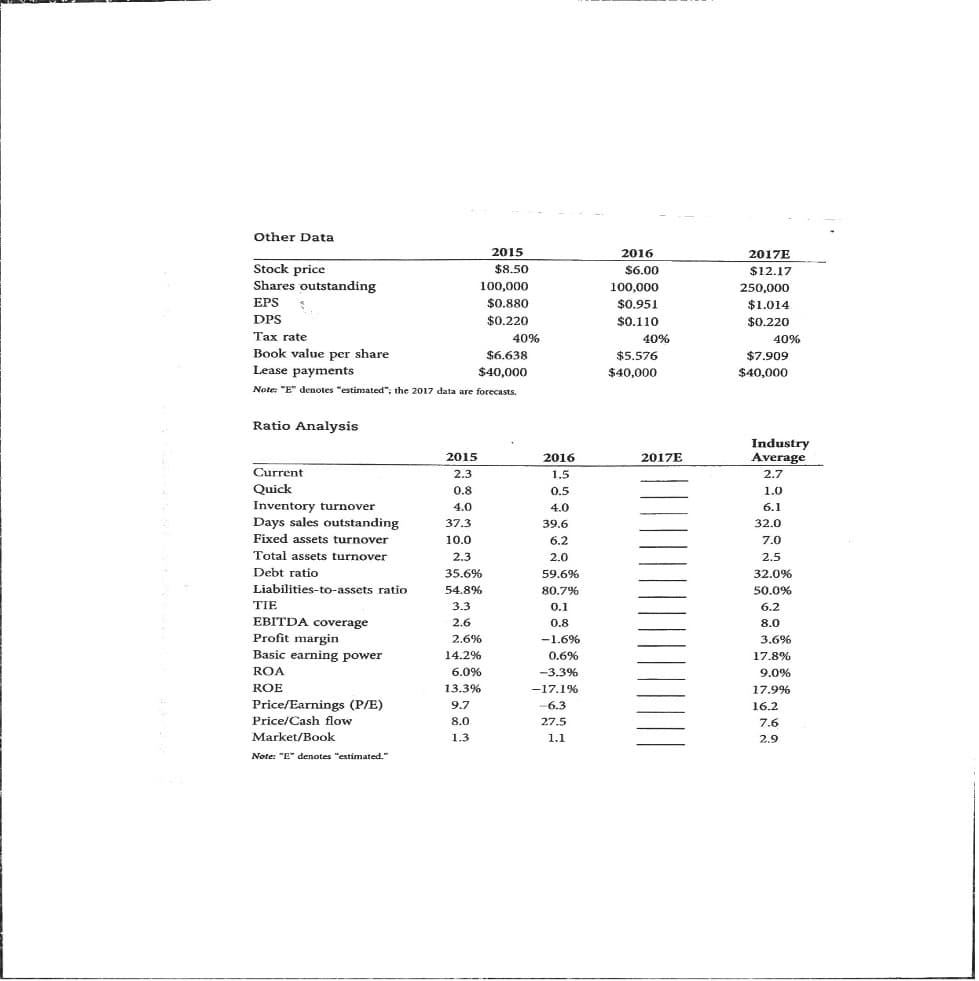
Transcribed Image Text:Other Data
2015
2016
2017E
Stock price
Shares outstanding
$8.50
$6.00
$12.17
100,000
100,000
250,000
EPS
$0.880
$0.951
$1.014
DPS
$0.220
$0.110
$0.220
Tax rate
40%
40%
40%
Book value per share
Lease payments
$6.638
$5.576
$7.909
$40,000
$40,000
$40,000
Note: "E" denotes "estimated"; the 2017 data are forecasts.
Ratio Analysis
Industry
Average
2015
2016
2017E
Current
2.3
1.5
2.7
Quick
0.8
0.5
1.0
Inventory turnover
Days sales outstanding
Fixed assets turnover
4.0
4.0
6.1
37.3
39.6
32.0
10.0
6.2
7.0
Total assets turnover
2.3
2.0
2.5
Debt ratio
35.6%
59.6%
32.0%
Liabilities-to-assets ratio
54.8%
80.7%
50.0%
TIE
3.3
0.1
6.2
EBITDA coverage
Profit margin
Basic earning power
2.6
0.8
8.0
2.6%
-1.6%
3.6%
14.2%
0.6%
17.8%
ROA
6.0%
-3.3%
9.0%
ROE
13.3%
-17.1%
17.9%
Price/Earnings (P/E)
Price/Cash flow
9.7
-6.3
16.2
8.0
27.5
7.6
Market/Book
1.3
1.1
2.9
Note: "E" denotes "estimated."
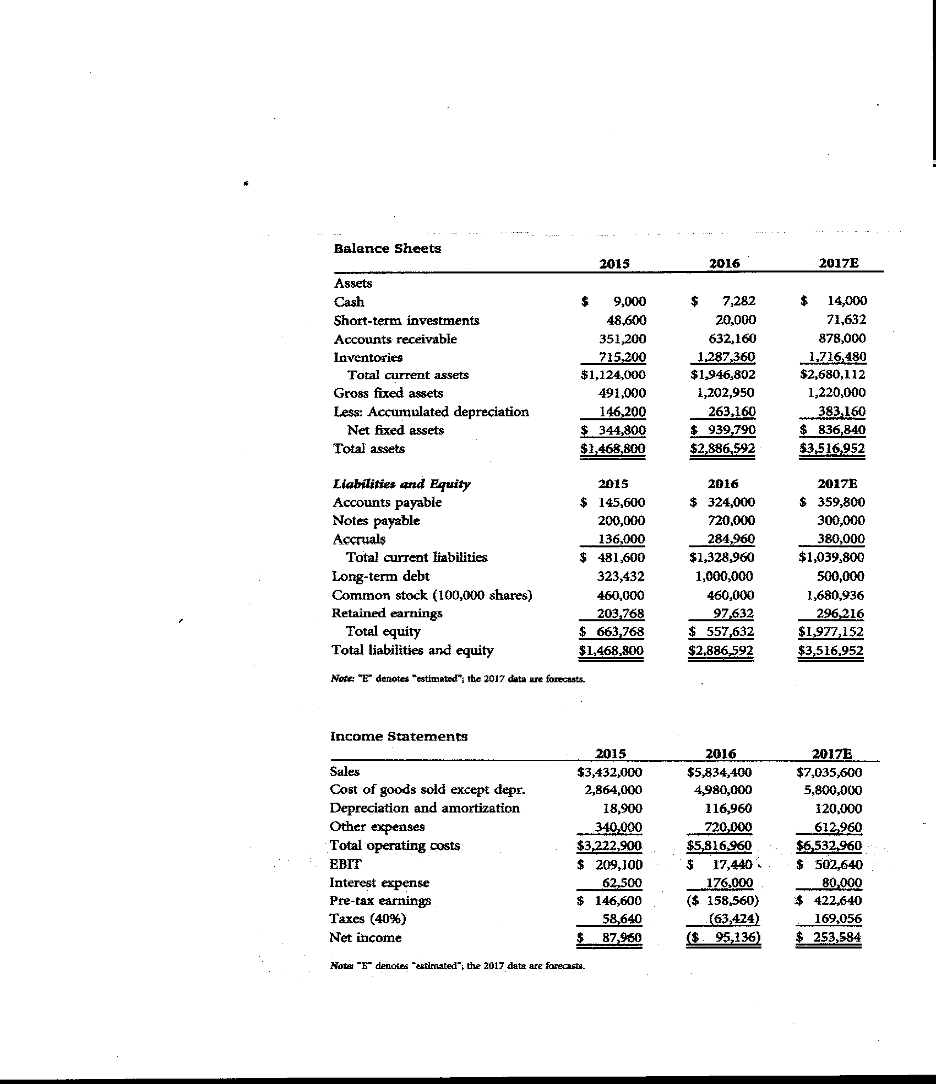
Transcribed Image Text:****. ..
Balance Sheets
2015
2016
2017E
Assets
Cash
2$
9,000
$
7,282
14,000
Short-term investments
48,600
20,000
71,632
Accounts receivable
351,200
632,160
878,000
1,716,480
$2,680,112
1,220,000
Inventories
715,200
1,287,360
$1,946,802
Total current assets
Gross fixed assets
$1,124,000
491,000
1,202,950
Less: Accumulated depreciation
146,200
$ 344,800
263,160
$ 939,790
m
$ 836,840
$3,516,952
383,160
Net fixed assets
Total assets
$1,468,800
$2,886,592
Liabilities and Equity
Accounts payable
Notes payable
Accruals
Total current liabilities
2015
2016
2017E
$ 145,600
$ 324,000
$ 359,800
200,000
720,000
300.000
380,000
136,000
$ 481,600
284,960
$1,328,960
$1,039,800
Long-term debt
Common stock (100,000 shares)
Retained earnings
Total equity
Total liabilities and equity
323,432
1,000,000
500,000
460,000
460,000
1,680,936
203,768
$ 663,768
$1,468,800
97,632
$ 557,632
296,216
$1,977,152
$2,886,592
$3,516,952
Note: "E denotes "estimated"; the 2017 data ure forecasts.
Income Statements
2015
2016
2017E
Sales
$3,432,000
$5,834,400
$7,035,600
5,800,000
Cost of goods sold except depr.
Depreciation and amortization
Other expenses
Total operating costs
2,864,000
4,980,000
18,900
116,960
720,000
$5,816,960
120,000
612,960
$6,532,960
$ 502,640
80,000
$ 422,640
169,056
$ 253,584
340,000
$3,222,900
EBIT
$ 209,100
17,440.
Interest expense
176,000
($ 158,560)
62,500
$ 146,600
Pre-tax earnings
Taxes (40%)
Net income
58,640
(63,424)
$ 87,960
($. 95,136)
Note "E" denotes "estimated"; the 2017 dats are forecasts.
Expert Solution
This question has been solved!
Explore an expertly crafted, step-by-step solution for a thorough understanding of key concepts.

This is a popular solution!

Trending now
This is a popular solution!

Step by step
Solved in 2 steps

Knowledge Booster


Learn more about
Need a deep-dive on the concept behind this application? Look no further. Learn more about this topic, accounting and related others by exploring similar questions and additional content below.Recommended textbooks for you

Accounting
Accounting
ISBN:
9781337272094
Author:
WARREN, Carl S., Reeve, James M., Duchac, Jonathan E.
Publisher:
Cengage Learning,

Accounting Information Systems
Accounting
ISBN:
9781337619202
Author:
Hall, James A.
Publisher:
Cengage Learning,
Accounting
Accounting
ISBN:
9781337272094
Author:
WARREN, Carl S., Reeve, James M., Duchac, Jonathan E.
Publisher:
Cengage Learning,
Accounting Information Systems
Accounting
ISBN:
9781337619202
Author:
Hall, James A.
Publisher:
Cengage Learning,

Horngren's Cost Accounting: A Managerial Emphasis…
Accounting
ISBN:
9780134475585
Author:
Srikant M. Datar, Madhav V. Rajan
Publisher:
PEARSON

Intermediate Accounting
Accounting
ISBN:
9781259722660
Author:
J. David Spiceland, Mark W. Nelson, Wayne M Thomas
Publisher:
McGraw-Hill Education

Financial and Managerial Accounting
Accounting
ISBN:
9781259726705
Author:
John J Wild, Ken W. Shaw, Barbara Chiappetta Fundamental Accounting Principles
Publisher:
McGraw-Hill Education