How to build a histogram based on this data

Functions and Change: A Modeling Approach to College Algebra (MindTap Course List)
6th Edition
ISBN:9781337111348
Author:Bruce Crauder, Benny Evans, Alan Noell
Publisher:Bruce Crauder, Benny Evans, Alan Noell
Chapter5: A Survey Of Other Common Functions
Section5.6: Higher-degree Polynomials And Rational Functions
Problem 5E: Population Genetics In the study of population genetics, an important measure of inbreeding is the...

Related questions
Question
How to build a histogram based on this data
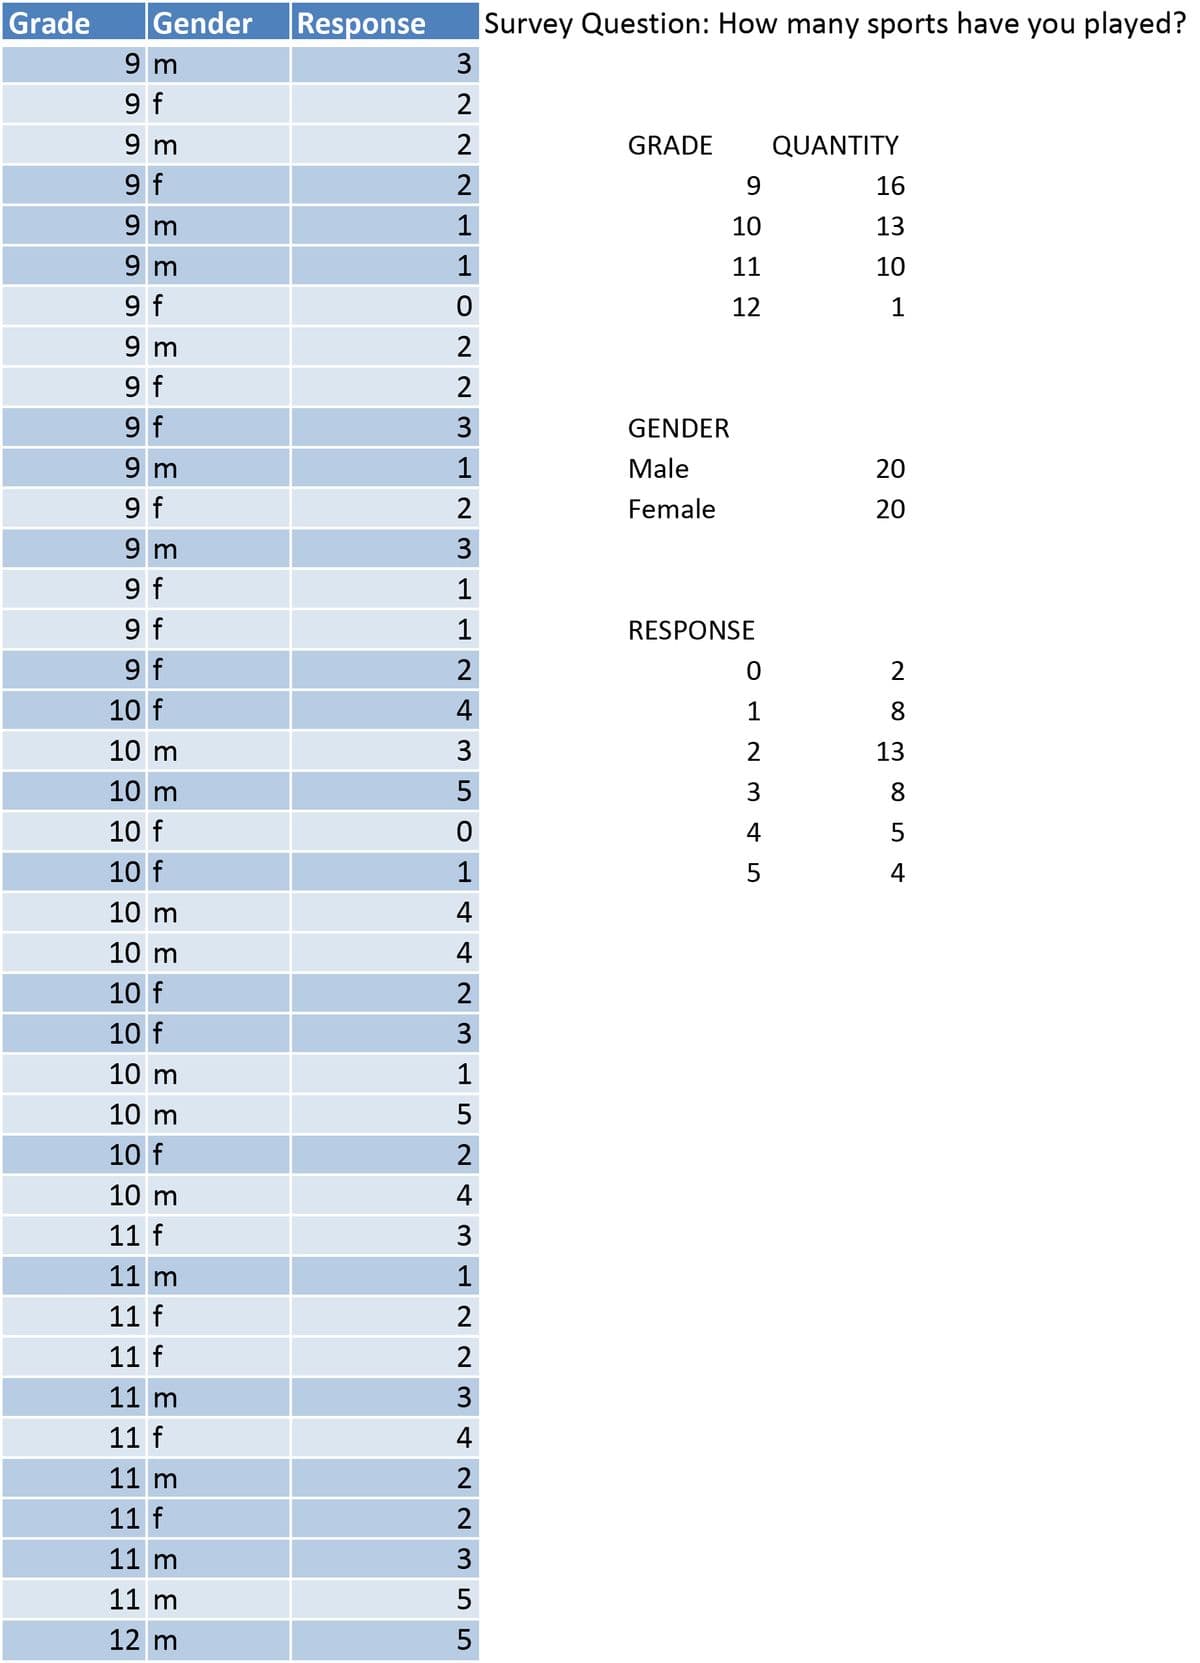
Transcribed Image Text:Grade
Gender
Response
Survey Question: How many sports have you played?
9 m
3
9 f
9 m
GRADE
QUANTITY
9 f
9.
16
9 m
1
10
13
9 m
1
11
10
9 f
12
1
9 m
9 f
9 f
3
GENDER
9 m
1
Male
20
9 f
2
Female
20
9 m
3.
9 f
1
9 f
9 f
1
RESPONSE
2
10 f
4
1
8.
10 m
3
13
10 m
5
3
8.
10 f
4
10 f
1
4
10 m
4
10 m
4
10 f
10 f
10 m
1
10 m
10 f
2
10 m
4
11 f
3
11 m
1
11 f
2
11 f
2
11 m
3
11 f
4
11 m
11 f
11 m
3
11 m
12 m
30
Expert Solution
This question has been solved!
Explore an expertly crafted, step-by-step solution for a thorough understanding of key concepts.

This is a popular solution!

Trending now
This is a popular solution!

Step by step
Solved in 3 steps with 4 images

Follow-up Questions
Read through expert solutions to related follow-up questions below.
Follow-up Question
how many sports played male vs female based on the data
Solution
Recommended textbooks for you
Functions and Change: A Modeling Approach to Coll…
Algebra
ISBN:
9781337111348
Author:
Bruce Crauder, Benny Evans, Alan Noell
Publisher:
Cengage Learning
Functions and Change: A Modeling Approach to Coll…
Algebra
ISBN:
9781337111348
Author:
Bruce Crauder, Benny Evans, Alan Noell
Publisher:
Cengage Learning