A state fisheries commission wants to estimate the number of bass caught in a given lake during a season in order to restock the lake with the appropriate number of young fish. The commission could get a fairly accurate assessment of the seasonal catch by extensive "netting sweeps" of the lake before and after a season, but this technique is much too expensive to be done routinely. Therefore, the commission samples a number of lakes and record the seasonal catch (thousands of bass per square mile of lake area) and size of lake (square miles). A simple linear regression was performed and the following R output obtained. Estimate Std. Error t value Pr(>|t|) (Intercept) 2.5463 0.4427 5.7513 0.0000 size 0.0667 0.3672 0.1818 0.8578 The residual plot is below. Notice how the residuals are randomly scattered for lake sizes up to approximately 0.8 square miles. Which of the following are noticeable in this plot? Check all that apply. Residual Plot 0.5 1.0 1.5 2.0 2.5 size of lake (sq, miles) While not bad, there is still a hint of curvature in the residual plot. Therefore, size of lake and seasonal catch are not linearly related. There are some outliers with unusual lake sizes compared to the rest of the lakes. O The relationship between size of lake and seasonal catch is fairly weak for lake sizes less than 1.0 square miles and then fairly strong for lake sizes greater than 1.0 square miles. There is no relationship between seasonal catch and size of lake. Residuals -1 0 1 2 3
A state fisheries commission wants to estimate the number of bass caught in a given lake during a season in order to restock the lake with the appropriate number of young fish. The commission could get a fairly accurate assessment of the seasonal catch by extensive "netting sweeps" of the lake before and after a season, but this technique is much too expensive to be done routinely. Therefore, the commission samples a number of lakes and record the seasonal catch (thousands of bass per square mile of lake area) and size of lake (square miles). A simple linear regression was performed and the following R output obtained. Estimate Std. Error t value Pr(>|t|) (Intercept) 2.5463 0.4427 5.7513 0.0000 size 0.0667 0.3672 0.1818 0.8578 The residual plot is below. Notice how the residuals are randomly scattered for lake sizes up to approximately 0.8 square miles. Which of the following are noticeable in this plot? Check all that apply. Residual Plot 0.5 1.0 1.5 2.0 2.5 size of lake (sq, miles) While not bad, there is still a hint of curvature in the residual plot. Therefore, size of lake and seasonal catch are not linearly related. There are some outliers with unusual lake sizes compared to the rest of the lakes. O The relationship between size of lake and seasonal catch is fairly weak for lake sizes less than 1.0 square miles and then fairly strong for lake sizes greater than 1.0 square miles. There is no relationship between seasonal catch and size of lake. Residuals -1 0 1 2 3

Holt Mcdougal Larson Pre-algebra: Student Edition 2012
1st Edition
ISBN:9780547587776
Author:HOLT MCDOUGAL
Publisher:HOLT MCDOUGAL
Chapter11: Data Analysis And Probability
Section11.4: Collecting Data
Problem 6E

Related questions
Question
Transcribed Image Text:A state fisheries commission wants to estimate the number of bass caught in a given lake during a season in order to
restock the lake with the appropriate number of young fish. The commission could get a fairly accurate assessment
of the seasonal catch by extensive "netting sweeps" of the lake before and after a season, but this technique is much
too expensive to be done routinely. Therefore, the commission samples a number of lakes and record the seasonal
catch (thousands of bass per square mile of lake area) and size of lake (square miles). A simple linear regression was
performed and the following R output obtained.
Estimate Std. Error
t value
Pr(>|t|)
(Intercept)
2.5463
0.4427
5.7513
0.0000
size
0.0667
0.3672
0.1818
0.8578
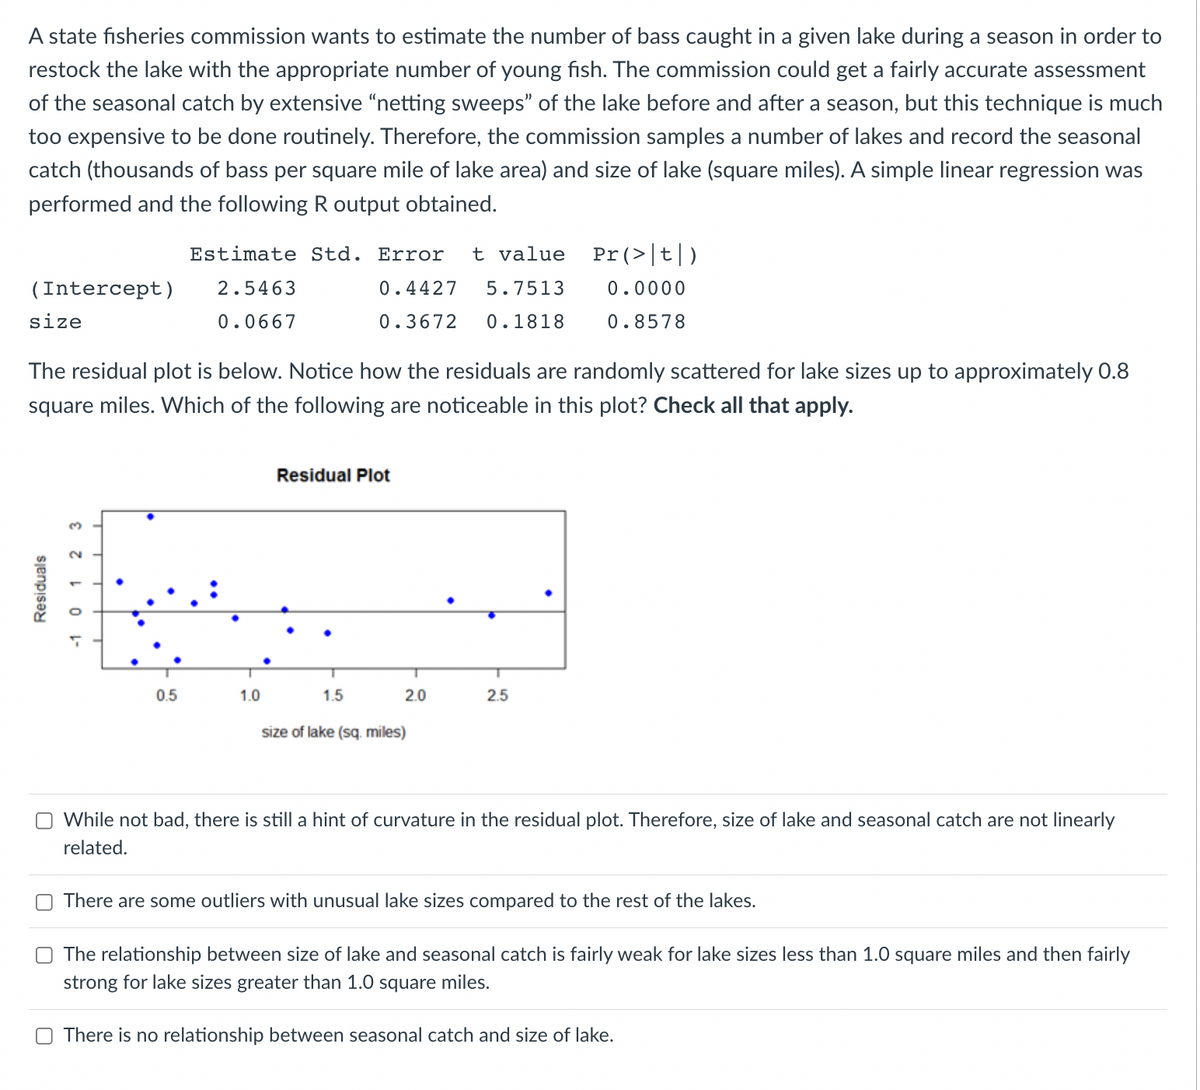
The residual plot is below. Notice how the residuals are randomly scattered for lake sizes up to approximately 0.8
square miles. Which of the following are noticeable in this plot? Check all that apply.
Residual Plot
0.5
1.0
1.5
2.0
2.5
size of lake (sq, miles)
While not bad, there is still a hint of curvature in the residual plot. Therefore, size of lake and seasonal catch are not linearly
related.
There are some outliers with unusual lake sizes compared to the rest of the lakes.
O The relationship between size of lake and seasonal catch is fairly weak for lake sizes less than 1.0 square miles and then fairly
strong for lake sizes greater than 1.0 square miles.
There is no relationship between seasonal catch and size of lake.
Residuals
-1 0 1 2 3
Expert Solution
This question has been solved!
Explore an expertly crafted, step-by-step solution for a thorough understanding of key concepts.

This is a popular solution!

Trending now
This is a popular solution!

Step by step
Solved in 2 steps

Recommended textbooks for you
Holt Mcdougal Larson Pre-algebra: Student Edition…
Algebra
ISBN:
9780547587776
Author:
HOLT MCDOUGAL
Publisher:
HOLT MCDOUGAL

Glencoe Algebra 1, Student Edition, 9780079039897…
Algebra
ISBN:
9780079039897
Author:
Carter
Publisher:
McGraw Hill

College Algebra (MindTap Course List)
Algebra
ISBN:
9781305652231
Author:
R. David Gustafson, Jeff Hughes
Publisher:
Cengage Learning
Holt Mcdougal Larson Pre-algebra: Student Edition…
Algebra
ISBN:
9780547587776
Author:
HOLT MCDOUGAL
Publisher:
HOLT MCDOUGAL
Glencoe Algebra 1, Student Edition, 9780079039897…
Algebra
ISBN:
9780079039897
Author:
Carter
Publisher:
McGraw Hill
College Algebra (MindTap Course List)
Algebra
ISBN:
9781305652231
Author:
R. David Gustafson, Jeff Hughes
Publisher:
Cengage Learning