How well does the regression line fit the observed data, what is the sample correlation coefficient between the two variables in this model and how can it be interpreted? Write the sample regression equation clearly defining the variables used.
How well does the regression line fit the observed data, what is the sample correlation coefficient between the two variables in this model and how can it be interpreted? Write the sample regression equation clearly defining the variables used.

College Algebra
7th Edition
ISBN:9781305115545
Author:James Stewart, Lothar Redlin, Saleem Watson
Publisher:James Stewart, Lothar Redlin, Saleem Watson
Chapter1: Equations And Graphs
Section: Chapter Questions
Problem 10T: Olympic Pole Vault The graph in Figure 7 indicates that in recent years the winning Olympic men’s...

Related questions
Question
How well does the regression line fit the observed data, what is the sample
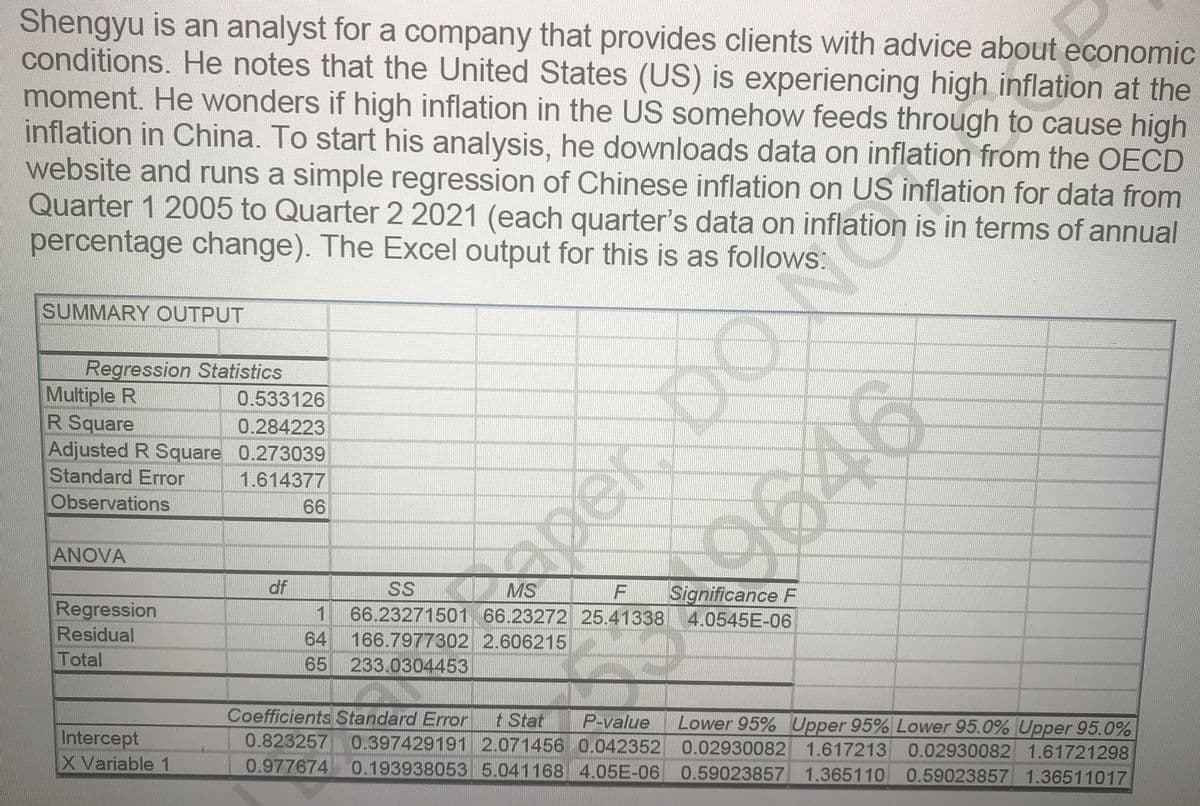
Transcribed Image Text:Shengyu is an analyst for a company that provides clients with advice about economic
conditions. He notes that the United States (US) is experiencing high inflation at the
moment. He wonders if high inflation in the US somehow feeds through to cause high
inflation in China. To start his analysis, he downloads data on inflation from the OECD
website and runs a simple regression of Chinese inflation on US inflation for data from
Quarter 1 2005 to Quarter 2 2021 (each quarter's data on inflation is in terms of annual
percentage change). The Excel output for this is as follows:
spér DO
19646
SUMMARY OUTPUT
Regression Statistics
Multiple R
R Square
Adjusted R Square 0.273039
Standard Error
Observations
0.533126
0.284223
1.614377
66
ANOVA
df
SS
MS
Significance F
Regression
Residual
66.23271501 66.23272 25.41338 4.0545E-06
64
166.7977302 2.606215
Total
65
233.0304453
Coefficients Standard Error
t Stat
P-value
Intercept
X Variable 1
Lower 95% Upper 95% Lower 95.0% Upper 95.0%
0.397429191 2.071456 0.042352 0.02930082 1.617213 0.02930082 1.61721298
0.193938053 5.041168 4.05E-06 0.59023857 1.365110 0.59023857 1.36511017
0.823257
0.977674
Expert Solution
This question has been solved!
Explore an expertly crafted, step-by-step solution for a thorough understanding of key concepts.

Step by step
Solved in 2 steps

Recommended textbooks for you
College Algebra
Algebra
ISBN:
9781305115545
Author:
James Stewart, Lothar Redlin, Saleem Watson
Publisher:
Cengage Learning


Algebra and Trigonometry (MindTap Course List)
Algebra
ISBN:
9781305071742
Author:
James Stewart, Lothar Redlin, Saleem Watson
Publisher:
Cengage Learning
College Algebra
Algebra
ISBN:
9781305115545
Author:
James Stewart, Lothar Redlin, Saleem Watson
Publisher:
Cengage Learning
Algebra and Trigonometry (MindTap Course List)
Algebra
ISBN:
9781305071742
Author:
James Stewart, Lothar Redlin, Saleem Watson
Publisher:
Cengage Learning

Trigonometry (MindTap Course List)
Trigonometry
ISBN:
9781305652224
Author:
Charles P. McKeague, Mark D. Turner
Publisher:
Cengage Learning

Glencoe Algebra 1, Student Edition, 9780079039897…
Algebra
ISBN:
9780079039897
Author:
Carter
Publisher:
McGraw Hill