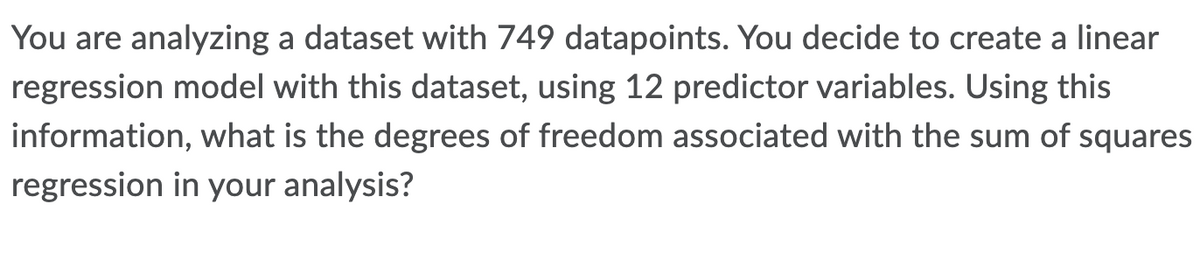
You are analyzing a dataset with 749 datapoints. You decide to create a linear regression model with this dataset, using 12 predictor variables. Using this information, what is the degrees of freedom associated with the sum of squares regression in your analysis?
Q: On a television show, eight contestants try to lose the highest percentage of weight in order to win…
A:
Q: City planners plan to survey residents to estimate the proportion of city residents who use public…
A: Voluntary response sample: A sample in which the respondents participate by themselves is called a…
Q: any financial institutions are unwittingly training their online customers to take risks with their…
A:
Q: Is there any significant difference in the impact of procrastination in academic performance of the…
A: Given:
Q: A textile fiber manufacturer is investigating a new drapery yarn, which the company claims has a…
A:
Q: 10. It is claimed by an advertisement that 4 out of 5 kids have energy gap. To test this, a random…
A:
Q: In 2016 the Better Business Bureau settled 80% of complaints they received in the United States.…
A:
Q: In a study of the accuracy of fast food drive-through orders, one restaurant had 39 orders that were…
A:
Q: Directions: On the first blank, write the critical values based on the given information. Then, on…
A: Since you have asked multiple question, we will solve the first question for you. If you want any…
Q: Example 13.6 From the data given in the following table, find out whether there is any relationship…
A: Chi square test is used to determine the relationship between various categorical variable. It is a…
Q: A random sample of 80 eighth grade students' scores on a national mathematics assessment test has a…
A:
Q: Which of the following statements about the correlation coefficient is correct? I. Positive…
A: Coefficient correlation : The coefficient of correlation could be a applied math live of the…
Q: According to a study done by UCB students, the height for Martian adult males is normally…
A: Given that Mean=66 Standard deviation=2.3
Q: Part 2 Correct Answer * Incorrect. Confidence level=99%, degrees of freedom=19 i 2.861 Your Answer
A:
Q: -or each of the problem given be arameter to be tested and the w each assumption. The breaking…
A: Parameter of interest there is sample of 50 cables is tested n=50 mean breaking strength is 1850…
Q: Two-Face decided to kill time by flipping four distinct coins. Describe Two-Face's imagined scenario…
A: Four distinct coins are flipped with some outcomes. The scenarios are to be described based on the…
Q: In order to conduct a hypothesis test for the population proportion, you sample 320 observations…
A: We have given thatn = 320x = 128p̂ = x/n = 128/320 = 0.4p = 0.45α = 0.05The null and alternative…
Q: (a) Determine the value of k for which f(x) is a legitimate pdf. (b) Obtain the cumulative…
A: To find the value of k we will use the fact that the integration of f(x) over whole range of X is…
Q: Chi-Squared lest A car dealer suspects that the weather of the day of the test drive has an effect…
A:
Q: If the coefficient of variation is 1% and the mean is 3.2, determine standard deviation (to four…
A: We have given that Mean(x̅) = 3.2 CV = 0.01
Q: A company providing mobile phone service plans has a list of phone numbers for their 125,000…
A: Given: x¯=10 s=8n=256
Q: If a single sample t-test is statistically significant... Then the t-statistic must not have fallen…
A:
Q: Develop a 95% confidence interval estimate of the mean amount spent per day by a family of four…
A: It is given that Sample size n = 64 Sample mean M = 252.45 Sample SD s = 74.50 The critical value of…
Q: Data showing the population by state as of 2012 in millions of people follow (The World Almanac). No…
A: Given Information: Consider the given data that shows the population by state in millions of people.
Q: Consider the following hypotheses: He: H 155 HA: < 155 The population is normally distributed. A…
A: Firstly we have to calculate the sample mean and sample SD for the given data.
Q: Suppose we wish to test Ho: µ = 47 versus Ha: µ > 47. What will result if we conclude that the mean…
A:
Q: 10. What is the computed test statistic?
A: It is given that Sample size n = 100 Sample mean M = 144 Population SD = 20 Population mean = 150
Q: 2. Ho: μ = 55 H₂: μ # 55 The sample mean is 60, the sample standard deviation is 5.4, and the sample…
A: Since you have asked multiple question, we will solve the first question for you. If you want any…
Q: i) Find the moment generating function of X = -cY. ii) What is the distribution of X?
A:
Q: You are analyzing a confidence interval using a 90% confidence level in your analysis. You collect a…
A: For 90% CI , Z value calcukated from the normal table. As 1.645
Q: QUESTION 3 Let X and Y be continuous random variables with a joint probability density function…
A: Given f(X,y)=k(x+y) 0≤x≤1
Q: Suppose that the duration of a particular type of criminal trial is known to be normally distributed…
A: Let X be the number of days from normal distribution with mean (μ) = 21 and standard deviation (σ)…
Q: An article in the Journal of the American Ceramic Society, "Rapid Hot-Pressing of Ultrafine PSZ…
A: Given βo^=55.626 β1^=-0.03416
Q: Consider the weighted voting system [21: 9, 8, 5, 3, 2], what is the total number of votes? Group of…
A: We have given the following data.
Q: Q2: Five jobs are to be processed through 3 machines M1 and M2 and M3 in the order M1, M2, M3. The…
A: Answers and the solution given below
Q: Please use the accompanying Excel data set or accompanying Text file data set when completing the…
A:
Q: It currently takes users a mean of 26 minutes to install the most popular computer program made by…
A:
Q: Suppose that 1000 customers are surveyed and 850 are satisfied or very satisfied with a…
A: Given,n=1000x=850sample proportion(p^)=xnsample proportion(p^)=8501000=0.85H0:P=0.9H1:P≠0.9α=0.095
Q: Refer to the accompanying table, which describes the number of adults in groups of five who reported…
A: There are 6 observations in the given table. The table represents probability distribution. We have…
Q: years is given by Derive the expected value of Y? yet 100 0, f(y)=- 0<y<∞ elsewhere
A: Solution
Q: Consider the following hypotheses: He: μ = 8 HA: 8 The population is normally distributed. A sample…
A: Given that μ = 8 Sample size (n) = 7 Firstly find sample mean and standard deviation By using one…
Q: In a normal distribution, what percentage of the area under the curve is within three standard…
A: We have given the following statement about normal distribution.
Q: In a study with a non-directional hypothesis… A) There are two rejection regions that have the same…
A: We have Given that the statement related to hypothesis testing here need to find out the correct…
Q: E 19. In exercise 7 a sales manager collected the following data on x = annual sales and y = years…
A: A sales manager collected the data on annual sales and years of experience.
Q: Example 13.9 A test in mathematics was given to students of two higher secondary schools in Delhi.…
A:
Q: The scores of Grade 11 students in an achievement test in Mathematics are normally distributed with…
A:
Q: Consider the compressive strength data from the table below. Consider the compressive strength data…
A: Solution: n= 80 Sample size of Aluminum Lithium Alloy Specimen. X represent the Aluminum Lithium…
Q: utcome is 00, 0, or 1, there is a probability of 38 of making a net profit of $60 and a 38…
A: Given playing roulette at a casino, a gambler is trying to decide whether to bet $20 on the number…
Q: W .00 110H₂:μ₁ sulav μ₂=0 H₁: μ₁ −μ₂ #0 drogeri belis-owl a botavanomab ow.alqmsxs gribo de al eal…
A: Given that : Sample 1 n1 = 80 m1 = 104 ?1 = 8.4 Sample 2 n2 = 70 m2 = 106 ?2 = 7.6 By using the two…
Q: The amount of coffee that people drink per day is normally distributed with a mean of 16 ounces and…
A: Solution-: Given: \mu=16, \sigma=5,n=9 Our aim to find, (a) Q1 for the average of 9 coffee drinkers…
Step by step
Solved in 2 steps
- how do the four assumptions underlying the GLM impact the data analysis process ?The report “airline Quality rating 2016” (www.airlinequalityrating.com/reports/2016_aQr_Final.pdf,retrieved april 22, 2017) included the accompanying data onthe on-time arrival percentage and the number of complaintsfiles per 100,000 passengers for U.S. airlines.The report did not include data on the number of complaintsfor two of the airlines. Use the given data from the otherairlines to fit the least squares regression line and use it topredict the number of complaints per 100,000 passengersfor Spirit and for Virgin America.A sociologist recorded the number of contacts entered in a cell phone and the number of texts sent in a week for 20 cell phone users. The resulting data were used to conduct a hypothesis test to investigate whether there is a linear relationship between the number of contacts and the number of texts sent. What are the correct hypotheses for the test?
- At the 5% significance level, are the predictor variables jointly significant? At the 5% significance level, evaluate each of the independent or predictor variables. Think about the five common problems with regression models, what is most likely wrong with this model?When conducting a retrospective cohort study what are some possible selection and information bias one can encounter especially because we have to use existing data? how can they be avoided or minimized (mitigated) during the study study design to avoid them?The dataset below was collected from a survey to determine whether CFT development in the island can be used as a strategy for the sustainable management and utilization of the fishery and aquatic resources in small islands. It shows the monthly income (in thousand pesos) estimated by 200 randomly selected fishers in Guimaras according to the type of fishers (i.e., the income source of fishers is solely fishing or they have alternative/supplemental livelihood such as island hopping services, sari-sari store ownership, fish value adding and/or vending, souvenir selling, carpentry, as construction worker, farming and tour guiding) and their perceived benefit from CFT development in the island. From this dataset and using = 0.05, is there a significant difference in estimated monthly income due tofisher type? How about due to the CFT perceived benefit? How about due to the interaction between fishertype and the perceived CFT benefit?a. Analyze manually and assume that the…
- Explain Pseudo out-of-sample forecasting? How this method estimates real-time performance of a forecasting model?A researcher is interested in examining whether doctors are as accurate at diagnosing certain illnesses via telehealth as they are in person. She randomly assigns a sample of doctors to either see patients via telehealth or in person, and assesses their diagnostic accuracy. What is the dependent variable?What is the least squares regression line . and what are the least squares point estimates ?Why is it dangerous to extrapolate outside the experimental region?
- The director of an obesity clinic in a large northwestern city believes that drinking soft drinks contribute to obesity in children. To determine whether a relationship exists between these two variables, she conducts the following pilot study. Eight- 12-year-old male volunteers are randomly selected from children attending a local junior high school. Parents of the children are asked to monitor the number of soft drinks consumed by their child over a one week period. The children are weighed at the end of the week and their weights converted into body mass index (BMI) values. The BMI is a common index used to measure obesity and takes into account both height and weight. An individual is considered obese if they have a BMI value 30. The following data or collected: child. # of soft drinks consumed BMI 1 3 20 2 1 18 3…Consider the outcome of serum concentration vitamin D and the predictor cardiorespiratory fitness. Provide a definition of confounding variables in the context of this study, and provide some examples of potential confounders.When we use a least-squares line to predict y values for x values beyond the range of x values found in the data, are we extrapolating or interpolating? Are there any concerns about such predictions?