How would you interpret these results for Groups 2 and 3? A post hoc test was not required Middle-age subjects and older subjects differed significantly in their ability to perform the Stroop task Middle-age subjects and older subjects performed equally well on the Stroop task
How would you interpret these results for Groups 2 and 3? A post hoc test was not required Middle-age subjects and older subjects differed significantly in their ability to perform the Stroop task Middle-age subjects and older subjects performed equally well on the Stroop task

MATLAB: An Introduction with Applications
6th Edition
ISBN:9781119256830
Author:Amos Gilat
Publisher:Amos Gilat
Chapter1: Starting With Matlab
Section: Chapter Questions
Problem 1P

Related questions
Question
Group 1 ->18-42 Years
Group 2 -> 43-67 Years
Group 3 -> 68-89 Years
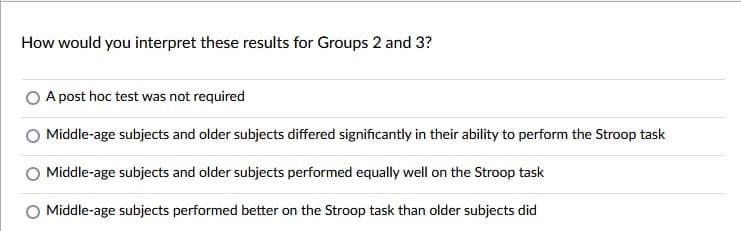
Transcribed Image Text:How would you interpret these results for Groups 2 and 3?
A post hoc test was not required
Middle-age subjects and older subjects differed significantly in their ability to perform the Stroop task
Middle-age subjects and older subjects performed equally well on the Stroop task
Middle-age subjects performed better on the Stroop task than older subjects did
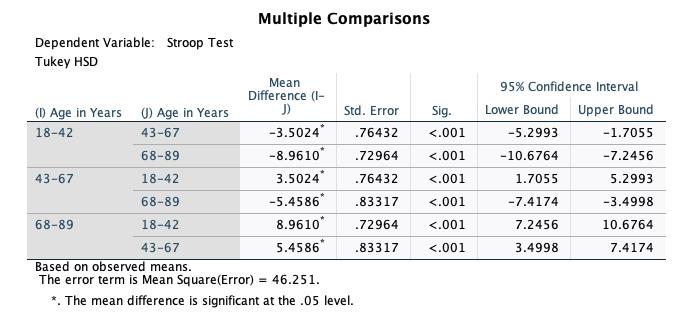
Transcribed Image Text:Multiple Comparisons
Dependent Variable: Stroop Test
Tukey HSD
Mean
Difference (I-
J)
95% Confidence Interval
(1) Age in Years () Age in Years
Std. Error
Sig.
Lower Bound Upper Bound
18-42
43-67
-3.5024
.76432
<.001
-5.2993
-1.7055
68-89
-8.9610*
.72964
<.001
-10.6764
-7.2456
3.5024
-5.4586
43-67
18-42
.76432
<.001
1.7055
5.2993
68-89
.83317
<.001
-7.4174
-3.4998
68-89
18-42
8.9610*
.72964
<.001
7.2456
10.6764
43-67
5.4586*
.83317
<.001
3.4998
7.4174
Based on observed means.
The error term is Mean Square(Error)
46.251.
*. The mean difference is significant at the .05 level.
Expert Solution
This question has been solved!
Explore an expertly crafted, step-by-step solution for a thorough understanding of key concepts.

This is a popular solution!

Trending now
This is a popular solution!

Step by step
Solved in 2 steps

Recommended textbooks for you
MATLAB: An Introduction with Applications
Statistics
ISBN:
9781119256830
Author:
Amos Gilat
Publisher:
John Wiley & Sons Inc

Probability and Statistics for Engineering and th…
Statistics
ISBN:
9781305251809
Author:
Jay L. Devore
Publisher:
Cengage Learning

Statistics for The Behavioral Sciences (MindTap C…
Statistics
ISBN:
9781305504912
Author:
Frederick J Gravetter, Larry B. Wallnau
Publisher:
Cengage Learning
MATLAB: An Introduction with Applications
Statistics
ISBN:
9781119256830
Author:
Amos Gilat
Publisher:
John Wiley & Sons Inc
Probability and Statistics for Engineering and th…
Statistics
ISBN:
9781305251809
Author:
Jay L. Devore
Publisher:
Cengage Learning
Statistics for The Behavioral Sciences (MindTap C…
Statistics
ISBN:
9781305504912
Author:
Frederick J Gravetter, Larry B. Wallnau
Publisher:
Cengage Learning

Elementary Statistics: Picturing the World (7th E…
Statistics
ISBN:
9780134683416
Author:
Ron Larson, Betsy Farber
Publisher:
PEARSON

The Basic Practice of Statistics
Statistics
ISBN:
9781319042578
Author:
David S. Moore, William I. Notz, Michael A. Fligner
Publisher:
W. H. Freeman

Introduction to the Practice of Statistics
Statistics
ISBN:
9781319013387
Author:
David S. Moore, George P. McCabe, Bruce A. Craig
Publisher:
W. H. Freeman